
1. ROC곡선
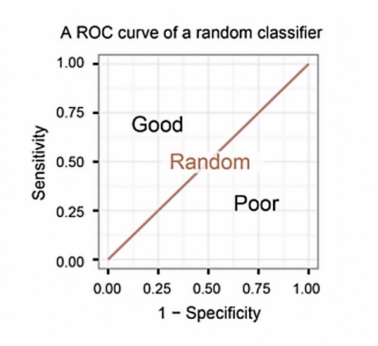
- FPR(False Positive Rate)과 TPR(True Positive Rate, Recall, Sensitivity)의 관계를 의미
- 분류기 성능이 Random하게 분류하는 경우와 비슷할수록 대각선에 가까워짐
- 분류기 성능이 좋을수록 RCO곡선 아래 면적(AUC)이 넓어짐

2. ROC 곡선 구현
와인 데이터 불러오기
import pandas as pd
red_url = 'https://raw.githubusercontent.com/PinkWink/\
				ML_tutorial/master/dataset/winequality-red.csv'
white_url = 'https://raw.githubusercontent.com/PinkWink/\
				ML_tutorial/master/dataset/winequality-white.csv'

red_wine = pd.read_csv(red_url, sep = ';')
white_wine = pd.read_csv(white_url, sep = ';')

red_wine['color'] =1
white_wine['color']=0

wine = pd.concat([red_wine, white_wine])

X = wine.drop(['color'], axis = 1)
y = wine['color']

wine['taste'] = [1 if grade > 5  else 0 for grade in wine['quality']]

X= wine.drop(['taste', 'quality'], axis = 1)
y = wine['taste']
모델 학습 및 예측시키기
from sklearn.model_selection import train_test_split
from sklearn.tree import DecisionTreeClassifier
from sklearn.metrics import accuracy_score

X_train, X_test, y_train, y_test = train_test_split(X, y, test_size = 0.2,\
															random_state = 13)

wine_tree = DecisionTreeClassifier(max_depth= 2, random_state = 13)
wine_tree.fit(X_train, y_train)

y_pred_tr = wine_tree.predict(X_train)
y_pred_test = wine_tree.predict(X_test)

print('Train Acc: ', accuracy_score(y_train, y_pred_tr))
print('Test Acc: ', accuracy_score(y_test, y_pred_test))
Train Acc: 0.7294593034442948
Test Acc: 0.7161538461538461
각 성능지표 출력하기
from sklearn.metrics import accuracy_score, precision_score,\
						recall_score, f1_score, roc_auc_score, roc_curve

print('Accuracy_score: ', accuracy_score(y_test, y_pred_test))
print('Recall: ', recall_score(y_test, y_pred_test))
print('Precision: ', precision_score(y_test, y_pred_test))
print('AUC Score: ', roc_auc_score(y_test, y_pred_test))
print('F1 Score: ', f1_score(y_test, y_pred_test))
Accuracy_score: 0.7161538461538461
Recall: 0.7314702308626975
Precision: 0.8026666666666666
AUC Score: 0.7105988470875331
F1 Score: 0.7654164017800381
1(red wine)로 분류하는 경우에 대한 확률 추출
pred_proba = wine_tree.predict_proba(X_test)[:, 1]

roc_curve(y_test, pred_proba)
(array([0. , 0.14884696, 0.25366876, 0.31027254, 1. ]),
array([0. , 0.45078979, 0.65492102, 0.73147023, 1. ]),
array([1.87802198, 0.87802198, 0.72692794, 0.67447307, 0.38397406]))
ROC 커브 그리기
import matplotlib.pyplot as plt
%matplotlib inline

#1일 확률만 추출
pred_proba = wine_tree.predict_proba(X_test)[:, 1]

# roc_curve가 반환하는 값이 3가지
fpr, tpr, thresholds = roc_curve(y_test, pred_proba)

plt.figure(figsize = (10,8))
plt.plot([0,1], [0,1]) # 파란색 직선으로 보조선 삽입
plt.plot(fpr, tpr) # 주황색 선. ROC_CURVE
plt.grid()
plt.show()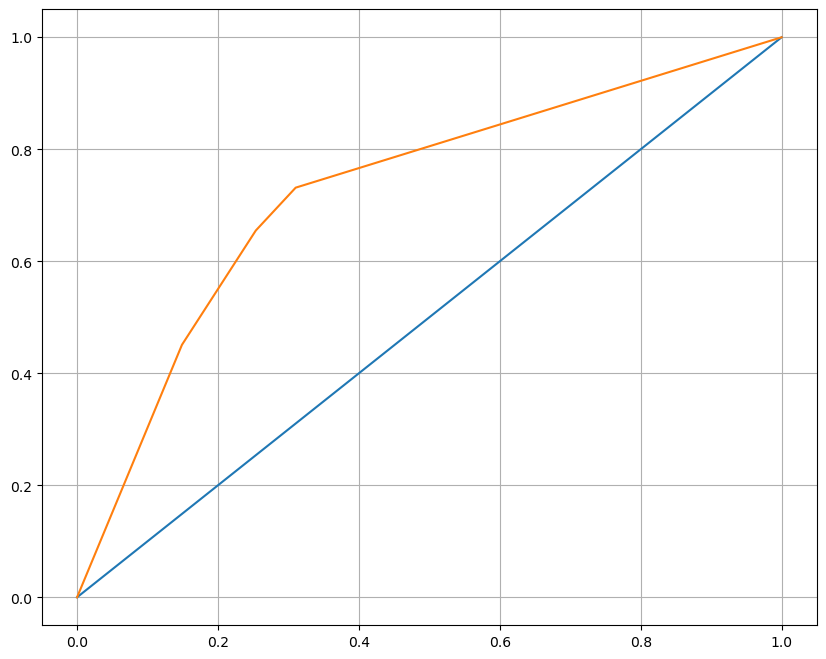

쉽고 유익하게 널리널리