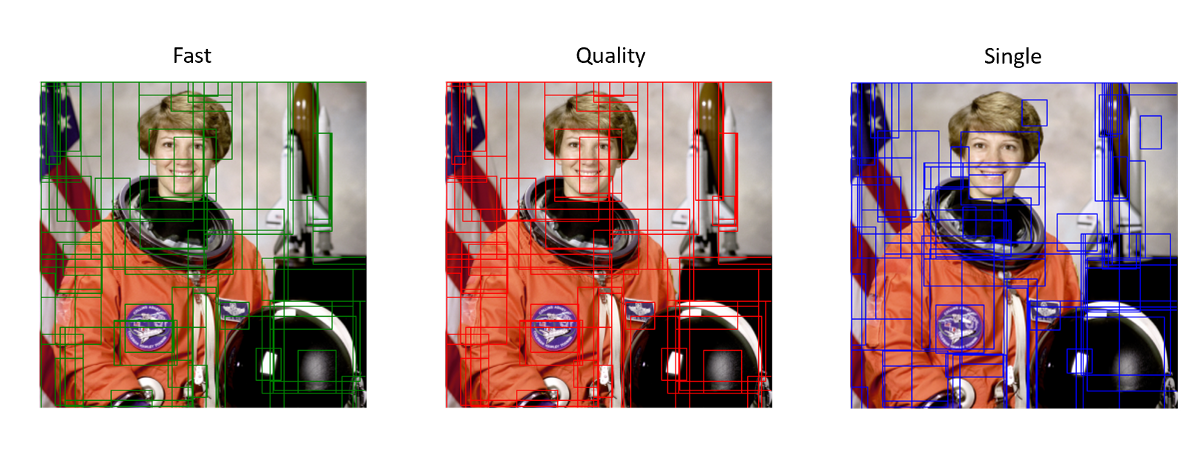
🙆♀️ Selective Search로 Region Proposal
selectivesearch 설치 및 이미지 로드
- 실습 환경: colab
- selectivesearch 설치
!pip install selectivesearch- 폴더 생성 및 이미지 로드
!mkdir /content/data

!wget -O /content/data/audrey01.jpg [주소 생략]- Python 모듈 추가 및 Rich output 표현을 위한 코드 작성
import selectivesearch
import cv2
import matplotlib.pyplot as plt
import os
%matplotlib inline- cv2로 이미지 로드 및 시각화
img=cv2.imread('./data/audrey01.jpg')
img_rgb=cv2.cvtColor(img, cv2.COLOR_BGR2RGB)
print('img shape:', img.shape)

plt.figure(figsize=(8,8))
plt.imshow(img_rgb)
plt.show()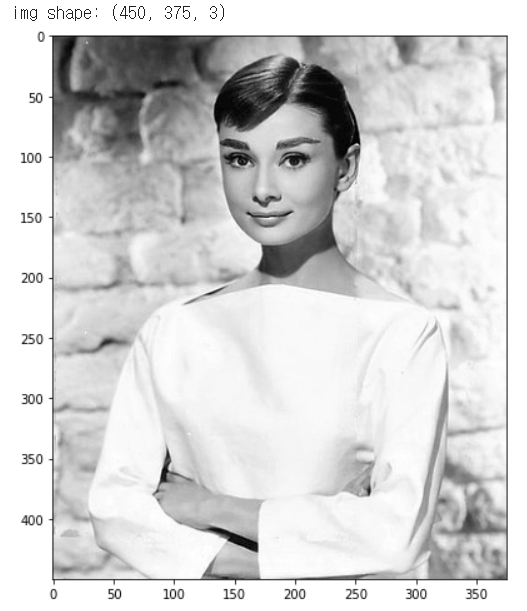
🙆♀️ 반환된 Region Proposal 정보 보기
- 이미지의 Region Proposal 정보 가져오기
selectivesearch.selective_search()- 반환 자료형은 튜플
# 첫번째 변수명은 큰 의미가 없으므로 언더바로 표현
_, regions = selectivesearch.selective_search(img_rgb, scale=100, min_size=2000)

print(type(regions), len(regions))<class 'list'> 41- 반환된 region 변수
- 리스트 타입
- 세부 원소로 사전(dictionary)형 가지고 있다
- 개별 사전 내 Key값 별 의미
- rect 키 값은 x,y 시작 좌표와 너비, 높이 값을 가진다
- rect 키 값은 Detected Object 후보를 나타내는 Bounding Box
- rect의 첫번째와 세번째 항을 더해 가로 길이 계산
- rect의 두번째와 네번째 항을 더해 세로 길이 계산
- size는 Object의 크기
- labels는 해당 rect로 지정된 Bounding Box 내에 있는 Object들의 고유 ID
- 아래로 내려갈수록
- 너비와 높이 값이 큰 Bounding Box
- 하나의 Bounding Box에 여러 개의 Object가 있을 확률 증가
regions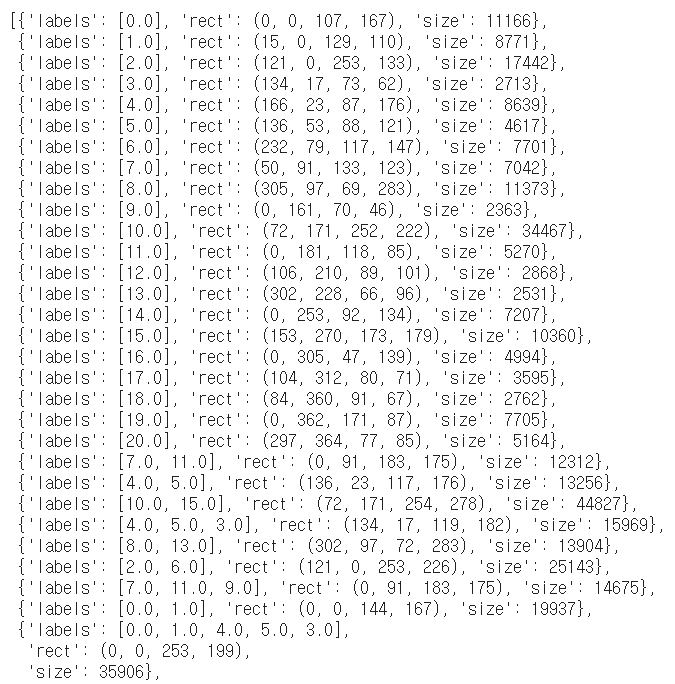
- rect 정보만 출력해서 보기
cand_rects = [cand['rect'] for cand in regions]
print(cand_rects)
[(0, 0, 107, 167), (15, 0, 129, 110), ...,(0, 0, 374, 449), (0, 0, 374, 449)]🙆♀️ Bounding Box 시각화
- opencv의 rectangle()
- 인자: 이미지와 좌상단 좌표, 우하단 좌표, box 컬러색, 두께
- 원본 이미지에 Bounding Box 그리는 함수
green_rgb = (125, 255, 51) # bounding box color
img_rgb_copy = img_rgb.copy() # 이미지 복사

for rect in cand_rects:
  left = rect[0]
  top = rect[1]
  # rect[2], rect[3]은 너비와 높이이므로 우하단 좌표를 구하기 위해 좌상단 좌표에 각각을 더함.
  right = left + rect[2]
  bottom = top + rect[3]
  img_rgb_copy = cv2.rectangle(img_rgb_copy, (left, top), (right, bottom), color=green_rgb, thickness=2)

plt.figure(figsize=(8, 8))
plt.imshow(img_rgb_copy)
plt.show()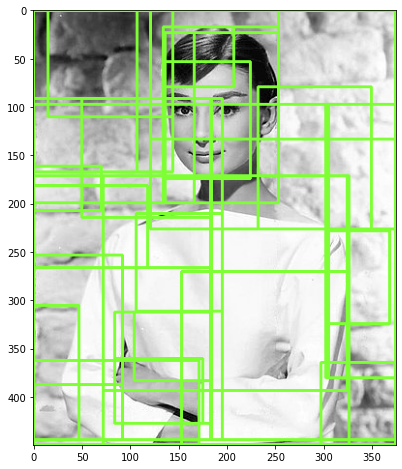
- bounding box의 크기가 큰 후보만 추출
cand_rects = [cand['rect'] for cand in regions if cand['size']>10000] # size가 10000보다 큰 경우만 추출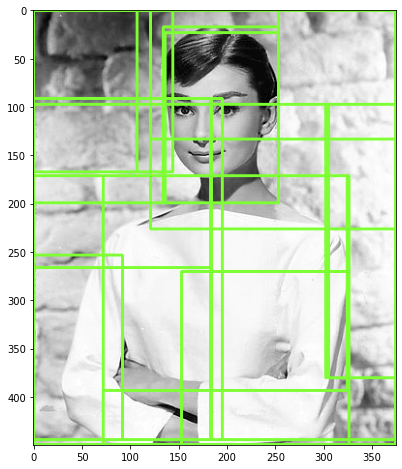
👮 IOU의 이해
Object Detection 성능 평가 Metric - IoU
- IoU(Intersection over Union)
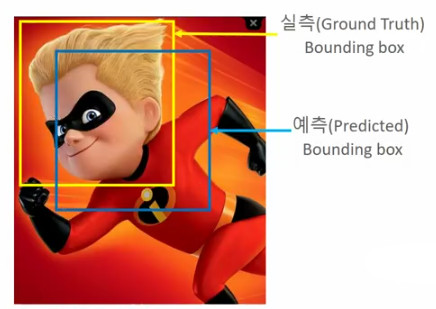
- 모델이 예측한 결과와 실측(Ground Truth) Box가 얼마나 정확하게 겹치는가를 나타내는 지표
- 개별 Box가 서로 겹치는 영역
- 전체 Box의 합집합 영역
- Area of Overlap(교집합) / Area of Union(합집합)
IoU에 따른 Detection 성능
- poor:
<0.5 - good:
>0.5 - excellent: 상대적으로 높을 때(0.936)
👮 IOU의 구현 실습
IOU 구하기
- 입력 인자로 후보 박스와 실제 박스를 받아서 IOU를 계산하는 함수 생성
compute_iou- GT와 cand의 x, y 좌표에서 min과 max 값 구하기
- x 좌표의 길이와 y 좌표의 길이를 통해 intersection의 넓이 구하기
- 합집합 연산을 통해 union 구하기
import numpy as np

def compute_iou(cand_box, gt_box):

  # Calculate intersection areas
  x1 = np.maxium(cand_box[0], gt_box[0])
  y1 = np.maxium(cand_box[1], gt_box[1])
  x2 = np.maxium(cand_box[2], gt_box[2])
  y2 = np.maxium(cand_box[3], gt_box[3])

  intersection = np.maximum(x2 - x1, 0) * np.maximum(y2 - y1, 0)

  cand_box_area = (cand_box[2] - cand_box[0]) * (cand_box[3] - cand_box[1])
  gt_box_area = (gt_box[2] - gt_box[0]) * (gt_box[3] - gt_box[1])
  union = cand_box_area + gt_box_area - intersection

  iou = intersection / union

return iou- Ground Truth 영역 그리기
import cv2
import matplotlib.pyplot as plt
%matplotlib inline

# 실제 box(Ground Truth)의 좌표를 아래와 같다고 가정
gt_box = [60, 15, 320, 420]

img = cv2.imread('./data/audrey01.jpg')
img_rgb = cv2.cvtColor(img, cv2.COLOR_BGR2RGB)

red = (255, 0, 0)
img_rgb = cv2.rectangle(img_rgb, (gt_box[0], gt_box[1]), (gt_box[2], gt_box[3]), color=red, thickness=2)

plt.figure(figsize=(8, 8))
plt.imshow(img_rgb)
plt.show()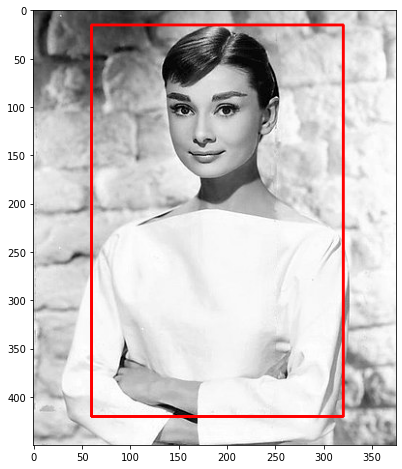
- 이미지의 Region Proposal 정보 가져오기
import selectivesearch

#selectivesearch.selective_search()는 이미지의 Region Proposal 정보를 반환
img = cv2.imread('./data/audrey01.jpg')
img_rgb2 = cv2.cvtColor(img, cv2.COLOR_BGR2RGB)

_, regions = selectivesearch.selective_search(img_rgb2, scale=100, min_size=2000)

print(type(regions), len(regions))<class 'list'> 41- IoU 목록 출력하기
- 튜플형으로 반환된 후보 box 목록들을 리스트화
- (Xmin, Ymin, w, h) >> (Xmin, Ymin, Xmax, Ymax)
- Xmin+w = Xmax
- Ymin+h = Ymax
- 아래로 내려갈수록 배수가 커진다
cand_rects = [cand['rect'] for cand in regions] # 튜플형 반환

for index, cand_box in enumerate(cand_rects):
    cand_box = list(cand_box)
    cand_box[2] += cand_box[0]
    cand_box[3] += cand_box[1]

    iou = compute_iou(cand_box, gt_box)
    print('index:', index, "iou:", iou)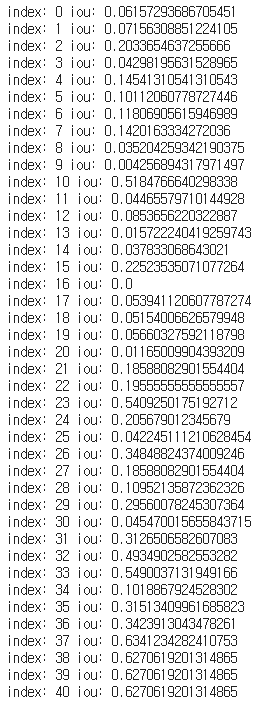
- bounding box의 크기가 큰 후보만 추출
cand_rects = [cand['rect'] for cand in regions if cand['size'] > 5000]
cand_rects.sort()
cand_rects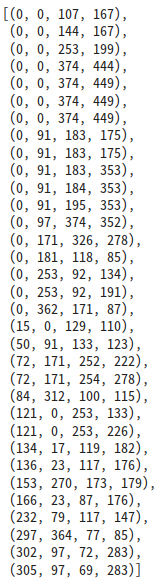
- iou 결과 시각화
img = cv2.imread('./data/audrey01.jpg')
img_rgb = cv2.cvtColor(img, cv2.COLOR_BGR2RGB)
print('img shape: ', img.shape)

green_rgb = (125, 255, 51)
cand_rects = [cand['rect'] for cand in regions if cand['size'] > 3000]
gt_box = [60, 15, 320, 420]
img_rgb = cv2.rectangle(img_rgb, (gt_box[0], gt_box[1]), (gt_box[2], gt_box[3]), color=red, thickness=2)

for index, cand_box in enumerate(cand_rects):

  cand_box = list(cand_box)
  cand_box[2] += cand_box[0]
  cand_box[3] += cand_box[1]

  iou = compute_iou(cand_box, gt_box)

  if iou > 0.0026:
    print('index:', index, "iou:", iou, 'rectangle: ', (cand_box[0], cand_box[1], cand_box[2], cand_box[3]))
    cv2.rectangle(img_rgb, (cand_box[0], cand_box[1]), (cand_box[2], cand_box[3]), color=green_rgb, thickness=1)
    text = "{}: {:.2f}".format(index, iou)
    cv2.putText(img_rgb, text, (cand_box[0]+100, cand_box[1]+10), cv2.FONT_HERSHEY_SIMPLEX, 0.4, color=green_rgb, thickness=1)

plt.figure(figsize=(12,12))
plt.imshow(img_rgb)
plt.show().png)
* 출처: 인프런 '딥러닝 컴퓨터 비전 완벽 가이드'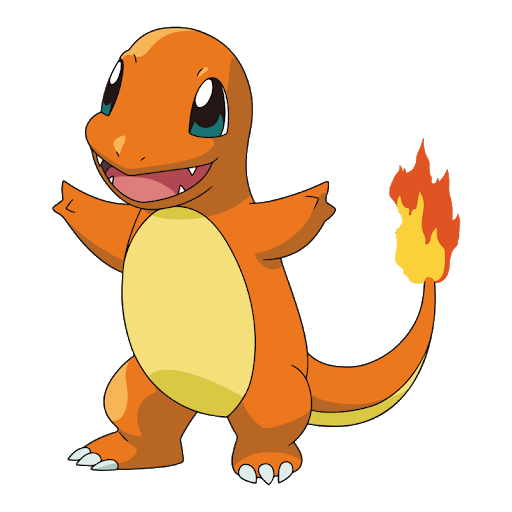
There's Only One Thing To Do: Learn All We Can