주성분 분석(PCA, Principal Component Analysis)
- 기본적으로 PCA는 선형 차원 감소 기법 (알고리즘)으로서, 머신 러닝 (ML)의 맥락에서 추가 회귀, 클러스터링 및 분류 작업에 유용 할 수있는 중요한 변수를 찾는 비지도 머신 러닝 알고리즘입니다.
- 고차원의 데이터일수록 표본의 밀도는 떨어지고, 높은 과대적합 위험과 계산 비용, 낮은 모델 성능 등 소위 차원의 저주 문제가 뒤따릅니다. 이러한 고차원 데이터를 기존의 분산을 최대한 보존하는 선형 독립의 새로운 변수들로 변환하여 기존의 변수보다 적은 개수로 차원 축소하는 것을 말합니다.
- 쉽게 말해, 상관성이 존재하는 p개의 변수로 이루어진 데이터 셋을 주성분이라고 하는 더 작은 k (k < p) 개의 상관되지 않은 변수로 변환 하면서 원본 데이터의 변동을 최대한 많이 유지합니다.
- 변수 간 상관 관계가 매우 높으면 PCA는 상관 관계가 높은 변수를 결합하려고 시도하고 고차원 데이터에서 최대 분산 방향을 찾습니다. 분산을 최대로 보존할 수 있는 축을 찾는 것이 정보를 가장 적게 손실할 수 있다고 생각할 수 있습니다. 분산이 커야 데이터들 사이의 차이점이 명확해질테고, 그것이 우리의 모델을 더 좋은 방향으로 만들 수 있게 됩니다.
실습
상관관계 파악
library(datasets)
head(USArrests) #data set

cor(USArrests)
pairs(USArrests, panel= panel.smooth, main= 'USA_Arrests')
# panel.smooth = 산점도 위 line 그리기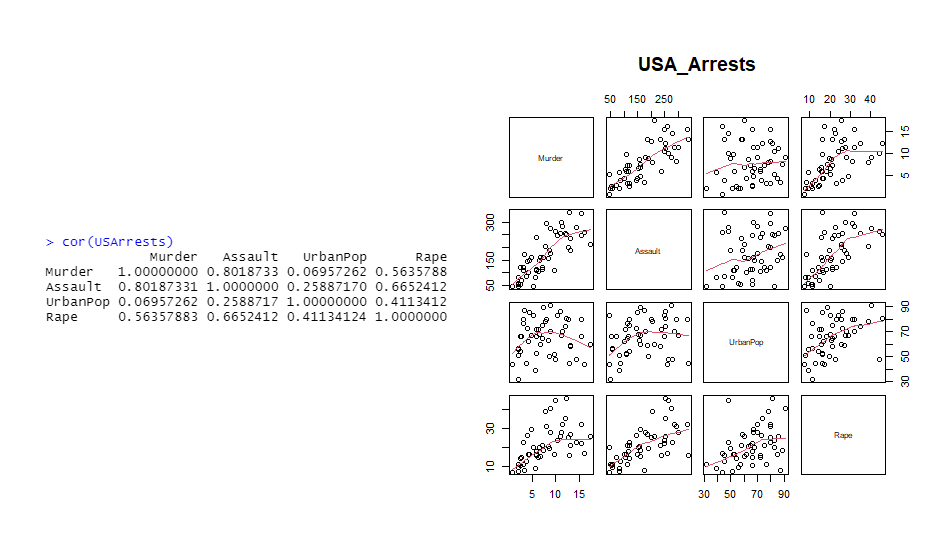
주성분 분석 실시
US.prin2 <- prcomp(USArrests, center = T, scale = T) #표준화 적용
# center = T는 중앙을 0으로, scale.=T 는 분산을 1로

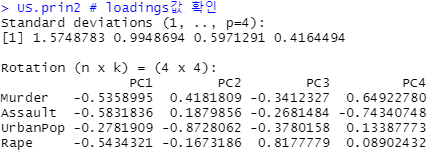
US.prin2
# loadings 값 확인
# loadings : 원 변수가 가진 고유벡터로서, 선형결합 시 계수를 의미
# ex) PC1 = -0.536*Murder + (-0.583)*Assault + (-0.278)*urbanPop ...
# == US.prin2$rotation 으로도 확인 가능
# 
score (주성분 점수) 확인
head(US.prin2$x)
# score : 주성분을 통해 계산된 각 행별 좌표를 의미
각 주성분의 표준편차, 분산 비율(기여율), 누적 기여율 확인
summary(US.prin2)
- 원 변수와 같은 수의 주성분이 생성됩니다.
- 일반적으로 누적 기여율이 85% 정도가 되는 부분까지만 주성분을 사용합니다.
- 이는 scree plot을 통해 사용할 주성분 개수를 정할 수도 있습니다.
scree plot
fviz_eig(US.prin2)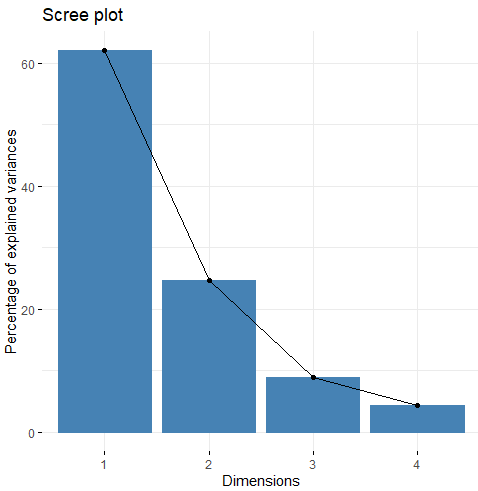
- 급격히 줄어들다가 완만해지는 부분 전까지를 고르면 됩니다.
- 즉, 2개까지만 사용합니다.
biplot
library(factoextra)
fviz_pca_biplot(US.prin2,
                label=c("var"),
                # label=c("var") : 데이터값 표시x, 화살표값만
                # label=c("var", "ind") : 데이터, 화살표 모두 표시
                col.var = 'contrib',
                # 원 변수의 기여율에 따라 색 지정
                repel = TRUE,
                # 텍스트 겹침 피하기
                addEllipses = TRUE,
                # 타원 보이기
                ellipse.level=0.95) +
  labs(title = 'USArrests PCA') +
  scale_color_gradient2(low="blue", mid="yellow",
                        high="red", midpoint = 25) #기울기에 따른 색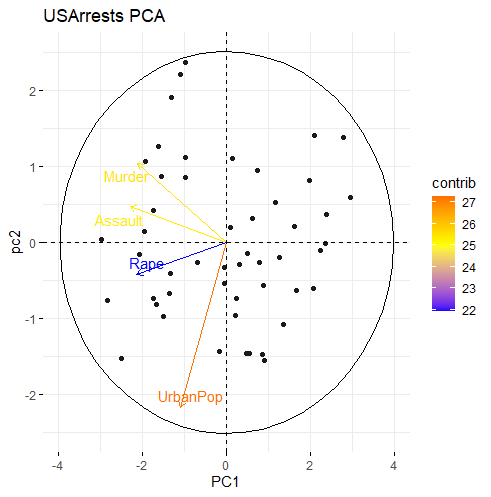
- biplot을 해석하는 방법 다음과 같습니다.
(1) 각 PC축에 가깝게 평행을 이루는 변수가 해당 PC에 영향을 가장 많이 주는 변수입니다.
(2) 각 화살표의 길이는 원 변수의 분산을 표현하며, 길이가 길수록 분산이 길다는 것입니다.
(3) 각 화살표가 가까울수록 두 원 변수는 서로 상관관계가 있으며, 반대로 거리가 멀수록 상관관계가 적다는 것입니다.
# 위 그래프의 결과를 해석하면,
PC1은 Murder, Assault, Rape 변수와 평행을 이룬다고 볼 수 있는데 각종 범죄와 관련된 변수라고 할 수 있습니다.
PC2는 UrbanPop 변수와 평행을 이루기에 도시인구와 관련된 변수라고 할 수 있습니다.
원 변수가 각 주성분에 기여하는 정도 확인
fviz_contrib(US.prin2, choice = "var", axes = 1, top = 4)
fviz_contrib(US.prin2, choice = "var", axes = 2, top = 4)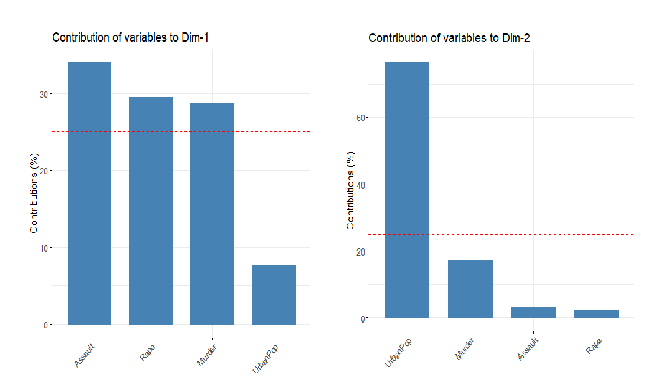
요인 분석(FA, Factor Analysis)
- 주성분분석과 마찬가지로 설명변수의 차원을 축소하기 위한 방법론 중의 하나로 샘플에 포함되어 있는 잠재적 요인을 추출하는데 사용합니다.
- 다만 주성분 분석의 경우 주성분으로 압축하기 위한 선형결합에서 오차항을 무시하지만(혹은 내포) 요인분석은 오차항을 독립적인 요인으로 간주하는 통계처리 방법입니다.
- 즉 주성분 분석의 경우에는 총 분산 = 공통 분산이라고 간주하고 분석을 수행하고 요인분석에서는 총 분산 = 공통 분산 + 개별 분산이라는 가정하에서 분석을 수행합니다.
- 구체적으로, 주성분분석의 경우 변수를 표준화 한 후에 분산-공분산 행렬을 구합니다. 이때 자기 자신의 상관행렬(대각)은 변수의 표준화를 수행하였기 때문에 모두 1이 됩니다. 그렇기 때문에 총 분산과 공통 분산이 일치하게 됩니다. 그러나 요인분석에서는 에러텀을 고려하기에 대각행렬을 1이 아닌 적절한 값(R 스퀘어 값)으로 대체하여 분석합니다.
실습
상관관계를 이용한 요인 개수 설정
# data set
min<- apply(swiss, 2, min)
max<- apply(swiss, 2, max)
swiss_scale<- scale(swiss, center = min, scale = max-min)
## min-max 스케일링

library(psych)
scree(cor(swiss_scale, use = "pairwise.complete.obs"))
## 결측값이 있는 case는 제거하고 상관계수 계산
- 2개의 요인으로 remodeling하면 최소의 오차를 가져오면서 성분에 대한 것을 가져갈 수 있을 것이라고 판단됩니다.
요인 분석 실시
fac<- factanal(swiss_scale,rotation= 'varimax', # 회전방법 지정
scores= 'regression', # 요인점수 계산 방법 지정
factors = 2) # 요인 개수 지정

fac
Call:
factanal(x = swiss_scale, factors = 2, scores = "regression", rotation = "varimax")
Uniquenesses:
Fertility Agriculture Examination Education
0.420 0.492 0.270 0.005
Catholic Infant.Mortality
0.061 0.960
Loadings:
Factor1 Factor2
Fertility -0.652 0.393
Agriculture -0.631 0.333
Examination 0.685 -0.510
Education 0.997
Catholic -0.124 0.961
Infant.Mortality 0.175
Factor1 Factor2
SS loadings 2.311 1.481
Proportion Var 0.385 0.247
Cumulative Var 0.385 0.632
Test of the hypothesis that 2 factors are sufficient.
The chi square statistic is 20.99 on 4 degrees of freedom.
The p-value is 0.000318
# loadings : 해당 변수가 요인에 의해 설명되는 분산의 비율을 의미
# SS loadings : 인자 부하량(loadings)의 제곱
## └이 값이 높을수록 변수간 유사성이 좋다는 것이다.
## 유의확률이 0.05가 넘어야 모델이 적절하다고 판단
## └즉 많은 성분들이 손실하지 않는다. (현 모델은 유의하지 않다.)
# sort(fac$uniquenesses) ## 적을수록 좋음 # 독자성 = 1-공통성
## └대게 0.5미만이면 좋다고 판단요인 적재량 확인
print(fac$loadings, cutoff=0.3)
## loading값이 0.3이상인 것들만을 표시
Loadings:
Factor1 Factor2
Fertility -0.652 0.393
Agriculture -0.631 0.333
Examination 0.685 -0.510
Education 0.997 -0.031
Catholic -0.124 0.961
Infant.Mortality -0.095 0.175
Factor1 Factor2
SS loadings 2.311 1.481
Proportion Var 0.385 0.247
Cumulative Var 0.385 0.632biplot
fac$scores # 인자 득점 == 원 데이터 좌표

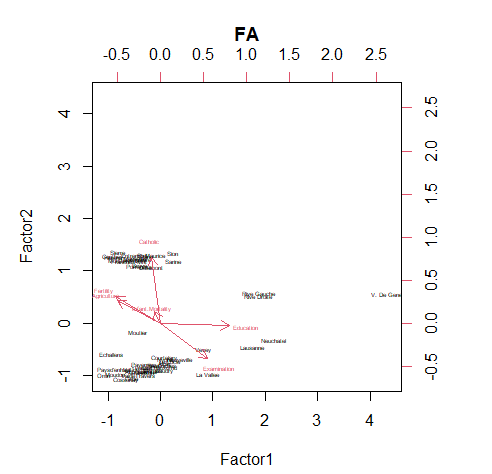
biplot(fac$scores, fac$loadings, cex = 0.4)