
📌 Notice
Kubernetes Advanced Networking Study (=KANS)
k8s 네트워크 장애 시, 네트워크 상세 동작 원리를 기반으로 원인을 찾고 해결하는 내용을 정리한 블로그입니다.
CloudNetaStudy그룹에서 스터디를 진행하고 있습니다.
Gasida님께 다시한번 🙇 감사드립니다.
EKS 관련 이전 스터디 내용은 아래 링크를 통해 확인할 수 있습니다.

📌 Summary
-
Cilium은 eBPF를 기반으로 Kubernetes 네트워크와 보안 관리를 가능하게 하는 CNI 플러그인으로, 네트워크 성능 최적화와 트래픽 관찰성을 제공합니다.
-
기존 iptables 기반의 네트워크 관리의 단점을 극복하며, eBPF 프로그램을 통해
kube-proxy 대체및Socket-Based LoadBalancing 기능을 수행하여 효율적이고 가벼운 네트워크 통신을 지원합니다. -
Hubble을 활용해 실시간으로 네트워크 흐름을 모니터링할 수 있으며, 네트워크 정책 적용 시 L3/L4뿐만 아니라 L7 수준의 HTTP 정책 관리도 지원해 접근 제어가 가능합니다.
-
Cilium
Egress Gateway와L2 Announcements는 클러스터 외부와의 통신을 효율적으로 관리하며, 서비스 고유의 IP 주소를 광고함으로써 네트워크 가용성을 증가시킵니다.
📌 Study
👉 Step 00. Cillium 소개
✅ BPF/eBPF 소개
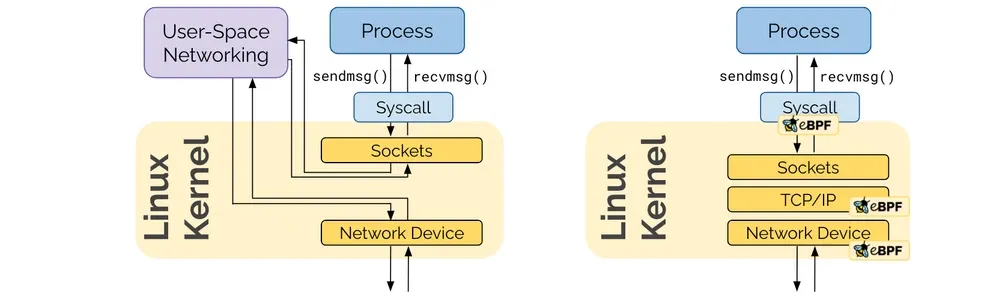
Linux Network Stack : 리눅스 네트워크 스택의 단점은 복잡하고, 변경에 시간이 걸리고, 레이어를 건너뛰기 어렵다.
 https://cilium.io/blog/2020/11/10/ebpf-future-of-networking/
Legacy iptables의 문제점
iptables는 몇 가지 중요한 문제를 가지고 있습니다:
- iptables 업데이트는 모든 규칙을 하나의 트랜잭션으로 재생성 및 업데이트해야 합니다.
- 규칙 체인을 연결 리스트로 구현하여 모든 작업이 O(n)입니다.
- iptables를 통한 접근 제어 리스트(ACL)의 표준 방식은 순차적인 규칙 목록을 사용하는 것입니다.
- IP 및 포트 매칭에 기반하며, L7 프로토콜은 고려하지 않습니다.
- 새로운 IP나 포트가 추가될 때마다 규칙을 추가하고 체인을 변경해야 합니다.
- Kubernetes에서 많은 리소스를 소비합니다.
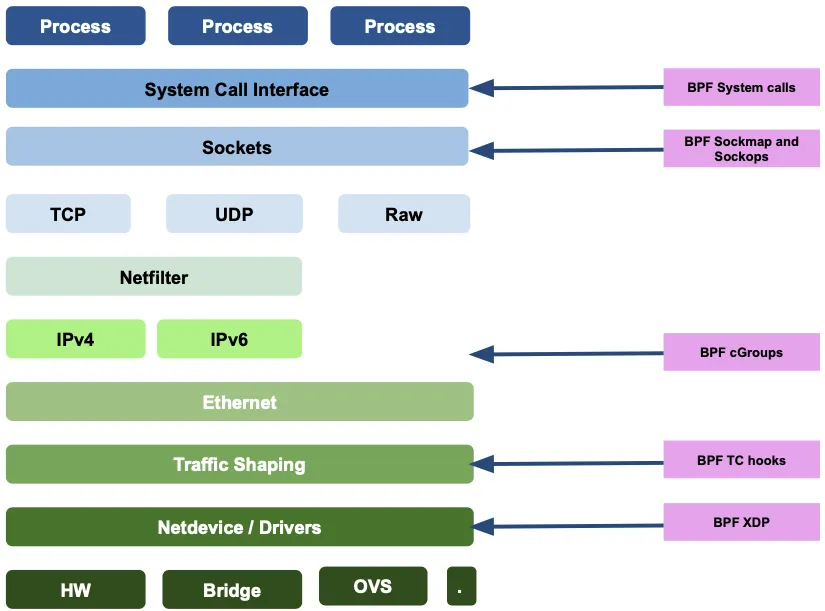
BPF (Berkeley Packet Filter) kernel hooks : BPF 는 커널에 삽입하여 패킷을 통제(필터링) 할 수 있으며, 다양한 영역에서 Hook 을 통해서 접근 할 수 있습니다.
 https://bit.ly/3EiLsU3
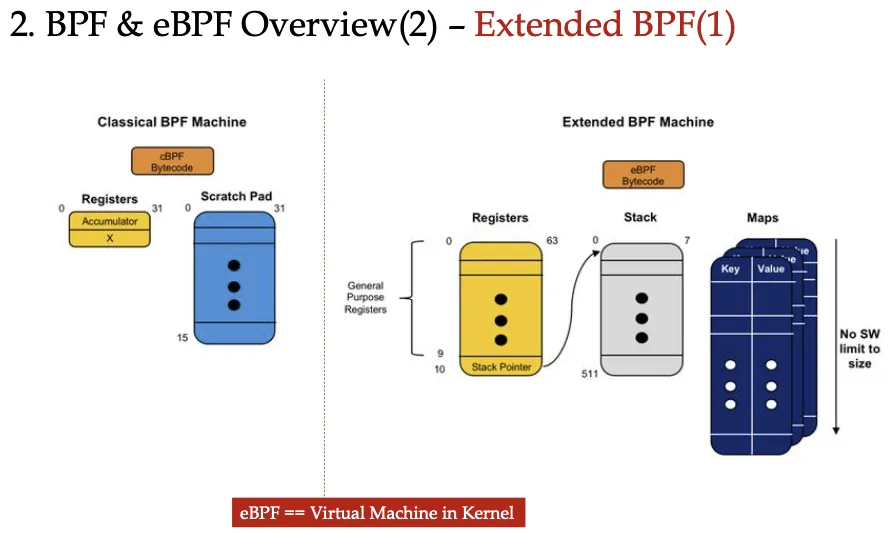
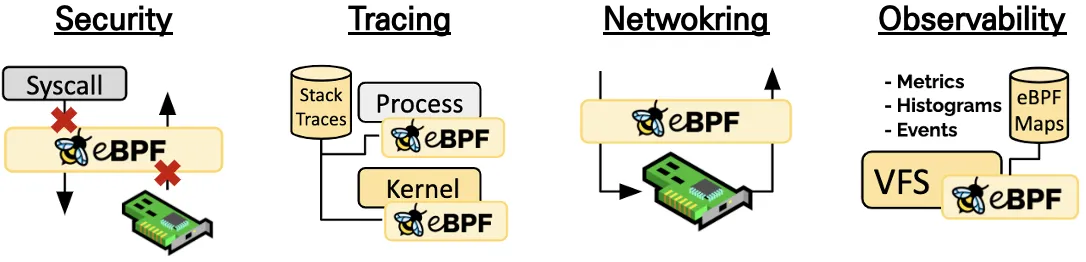
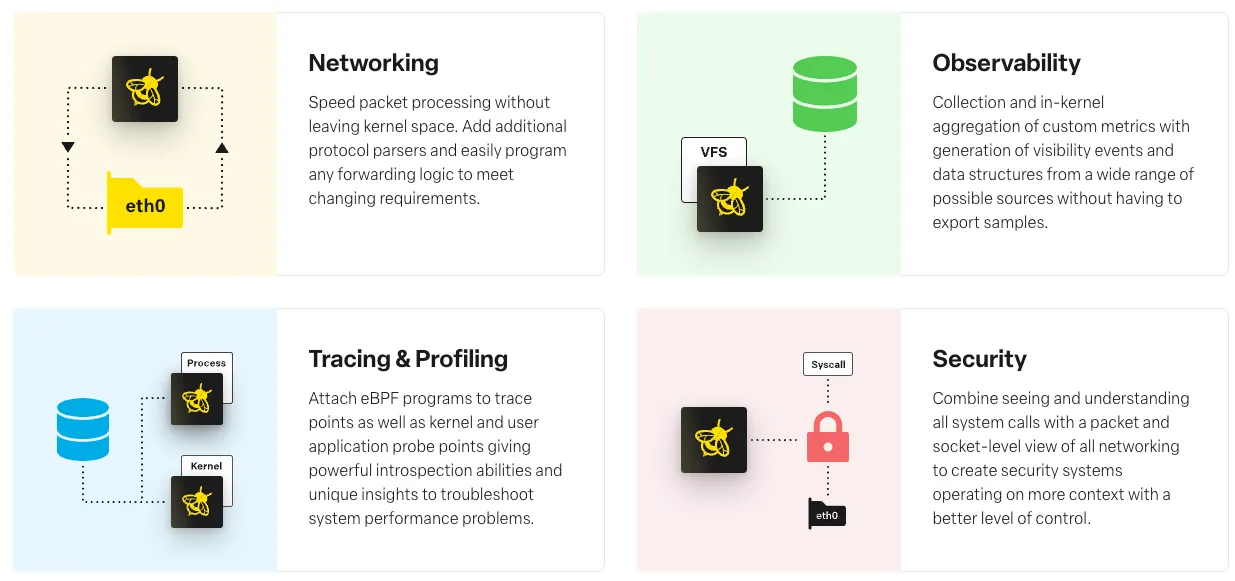
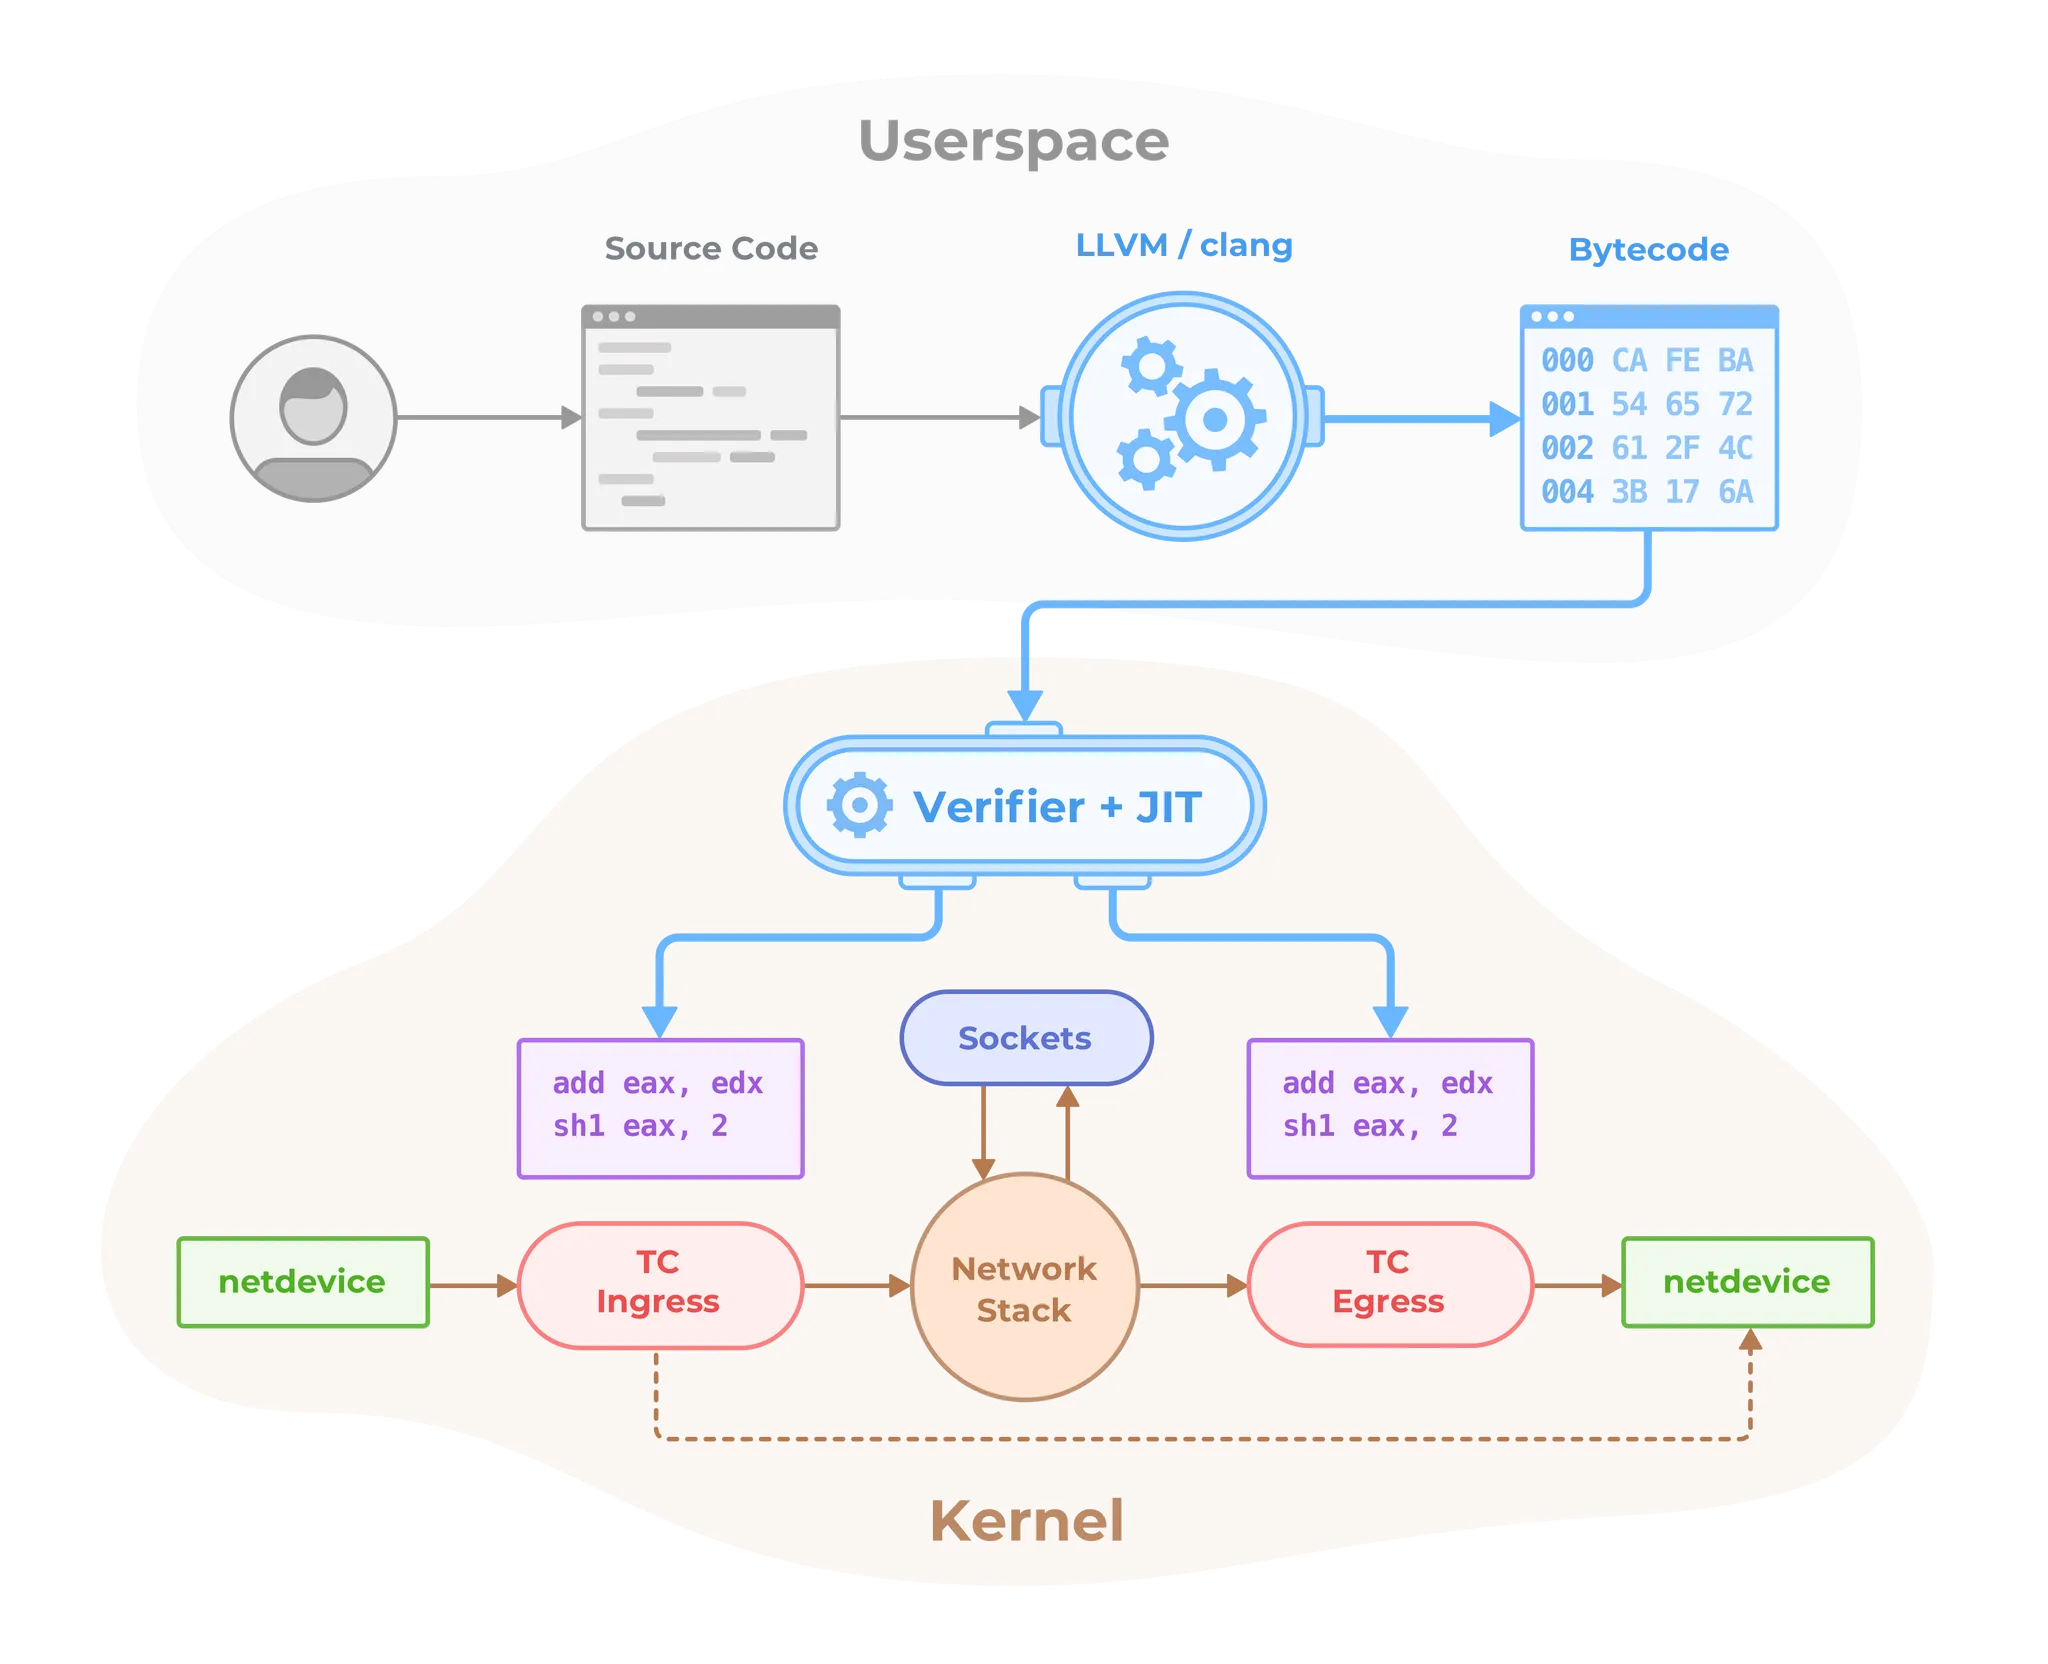
extended Berkeley Packet Filter(eBPF)
Dynamically program the kernel for efficient networking, observability, tracing, and security
BPF(1992년) 를 확장해서
eBPF가 (2014년, Alexei Starovoitov) 가 나왔고, eBPF 를 다양한 영역 (보안, 추적, 네트워킹, 모니터링)에서 활용하기 시작하였습니다.
커널 내에 (샌드박스 내에서) 자유롭게 프로그래밍하여 적용 할 수 있다
✅ Cillium 소개
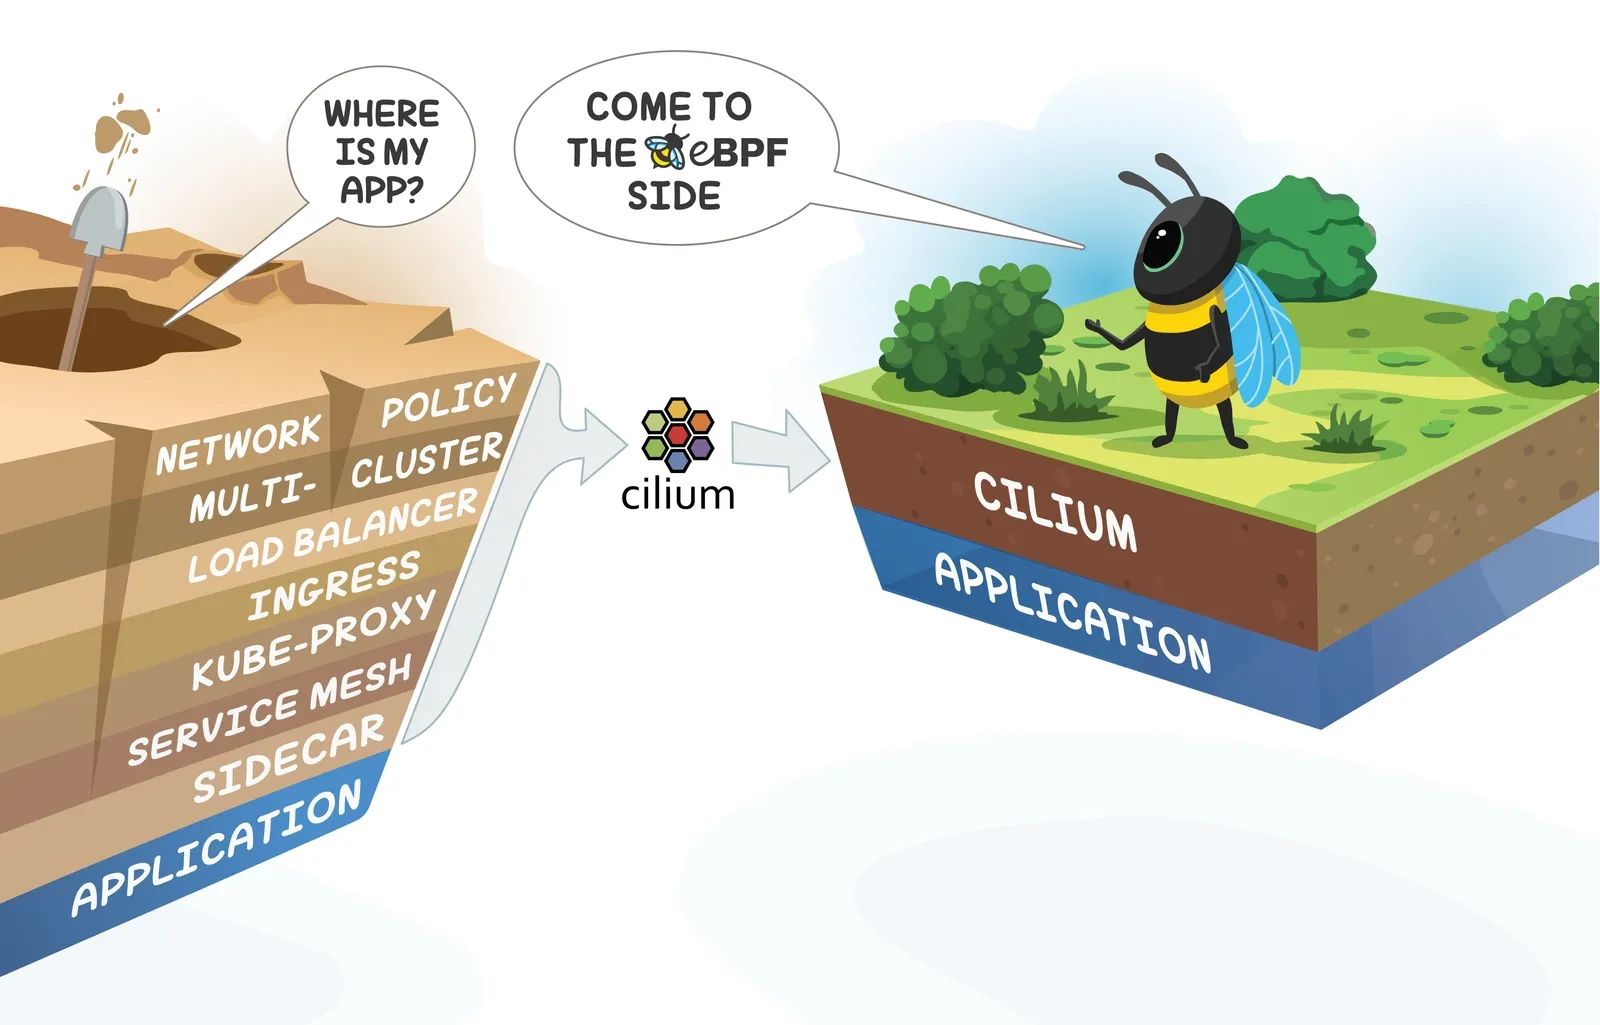
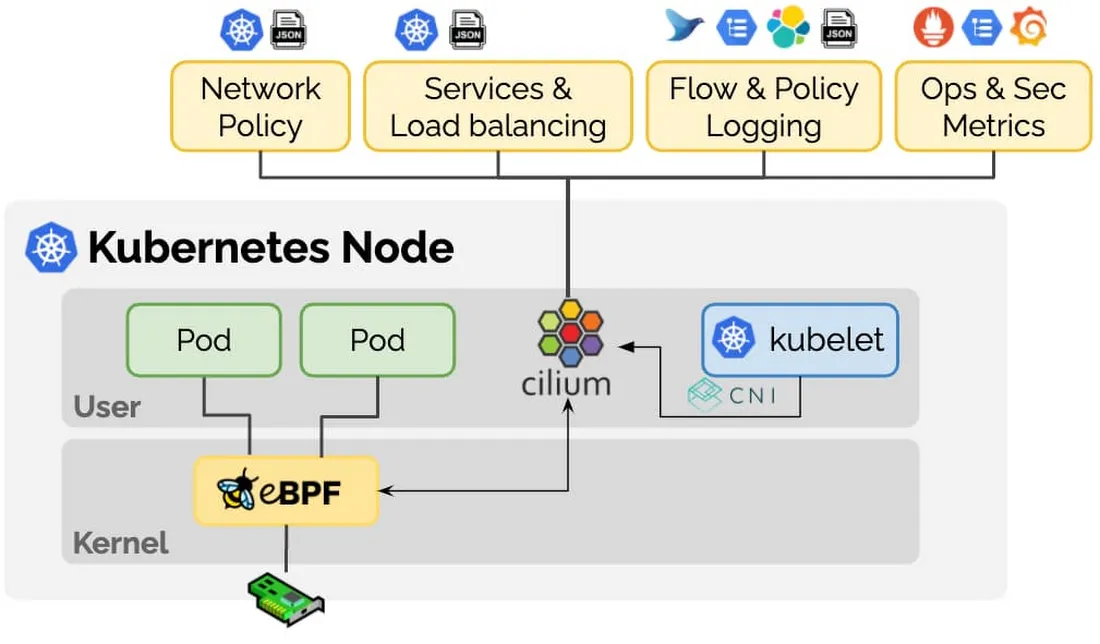
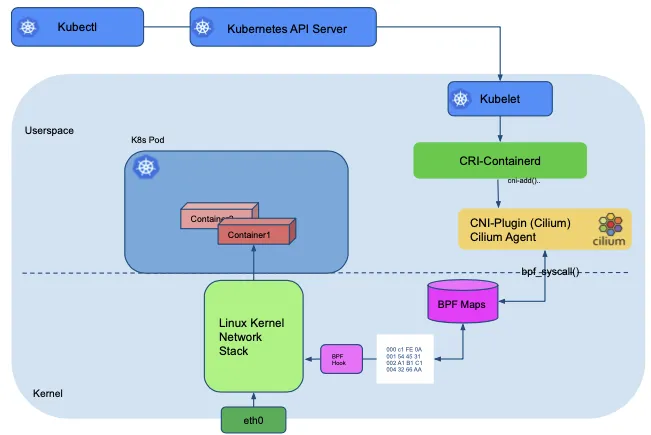
Cilium은 eBPF (Berkeley Packet Filter)를 기반으로 Pod Network 환경 + 보안 을 제공하는 CNI Plugin 입니다
 https://isovalent.com/blog/post/migrating-from-metallb-to-cilium/
Kubernetes와 같은 Linux 컨테이너 관리 플랫폼을 사용하여 배포된 응용 프로그램 서비스 간의 네트워크 및 API 연결을 제공하는 오픈 소스 소프트웨어 입니다.
 https://cilium.io/blog/2020/11/10/ebpf-future-of-networking/
Cilium eBPF 는 추가적인 App 이나 설정 변경 없이 리눅스 커널을 자유롭게 프로그래밍하여 동작 가능합니다.
Kernel Layer에서 동작하는 Bytecode를 안전하게 Kernel에 Loading(injection) 할 수 있다
https://cilium.io/blog/2020/11/10/ebpf-future-of-networking/
Cilium attaches eBPF programs to ingress TC hooks of these links in order to intercept all incoming packets for further processing.
- 모든 패킷을 가로채기 위해서 수신 NIC 의 ingress TC hooks 을 사용한다
- Linux TC(Traffic Control) : 커널에서 동작하는 패킷 스케줄러 - 링크
2가지 네트워크 모드를 제공 : 터널 모드(VXLAN, GENEVE), 네이티브 라우팅 모드
- 터널 모드에서 실리움은 여러 VXLAN(UDP 8472) 또는 Geneve(UDP 6081) 인터페이스를 설정하고 이를 통해 트래픽을 전달합니다.
- 네이티브 라우팅 모드에서는 실리움이 외부에서 제공된다고 가정할 때 도달 가능성을 설정하는 데 아무런 조치를 취하지 않습니다.
https://docs.cilium.io/en/stable/concepts/networking/routing/#native-routing
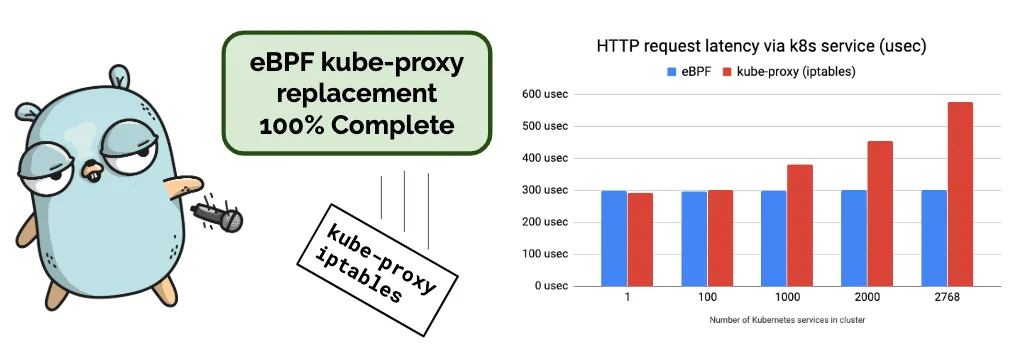
- 100% Kube-proxy replacement : iptables 거의 사용하지 않아도 동작, Datapath Optimizations (iptables bypass) - Docs
- 하지만 iptables 기능을 활용하는 일부 동작들은 이슈가 발생할 수 있음, 물론 지속해서 해당 이슈를 해결하고 있음 (예. istio, FHRP/VRRP - 링크)
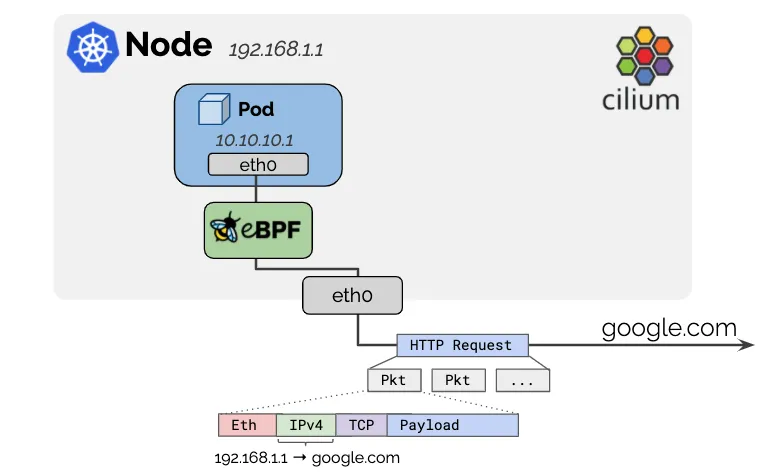
- 예시) 기존의 IPtables 를 사용하지 않고, eBPF 로 Masqueading(SNAT) 처리
✅ Cilium 아키텍처
 https://github.com/cilium/cilium
-
Cilium Agent : 데몬셋으로 실행, K8S API 설정으로 부터 '네트워크 설정, 네트워크 정책, 서비스 부하분산, 모니터링' 등을 수행하며, eBPF 프로그램을 관리한다.
-
Cilium Client (CLI) : Cilium 커멘드툴, eBPF maps 에 직접 접속하여 상태를 확인할 수 있다.
-
Cilium Operator : K8S 클러스터에 대한 한 번씩 처리해야 하는 작업을 관리.
-
Hubble : 네트워크와 보안 모니터링 플랫폼 역할을 하여, 'Server, Relay, Client, Graphical UI' 로 구성되어 있다.
-
Data Store : Cilium Agent 간의 상태를 저장하고 전파하는 데이터 저장소, 2가지 종류 중 선택(K8S CRDs, Key-Value Store)
👉 Step 01. Cilium 배포
✅ 배포
Cilium 설치 정보(w/Helm) 및 확인 - Docs
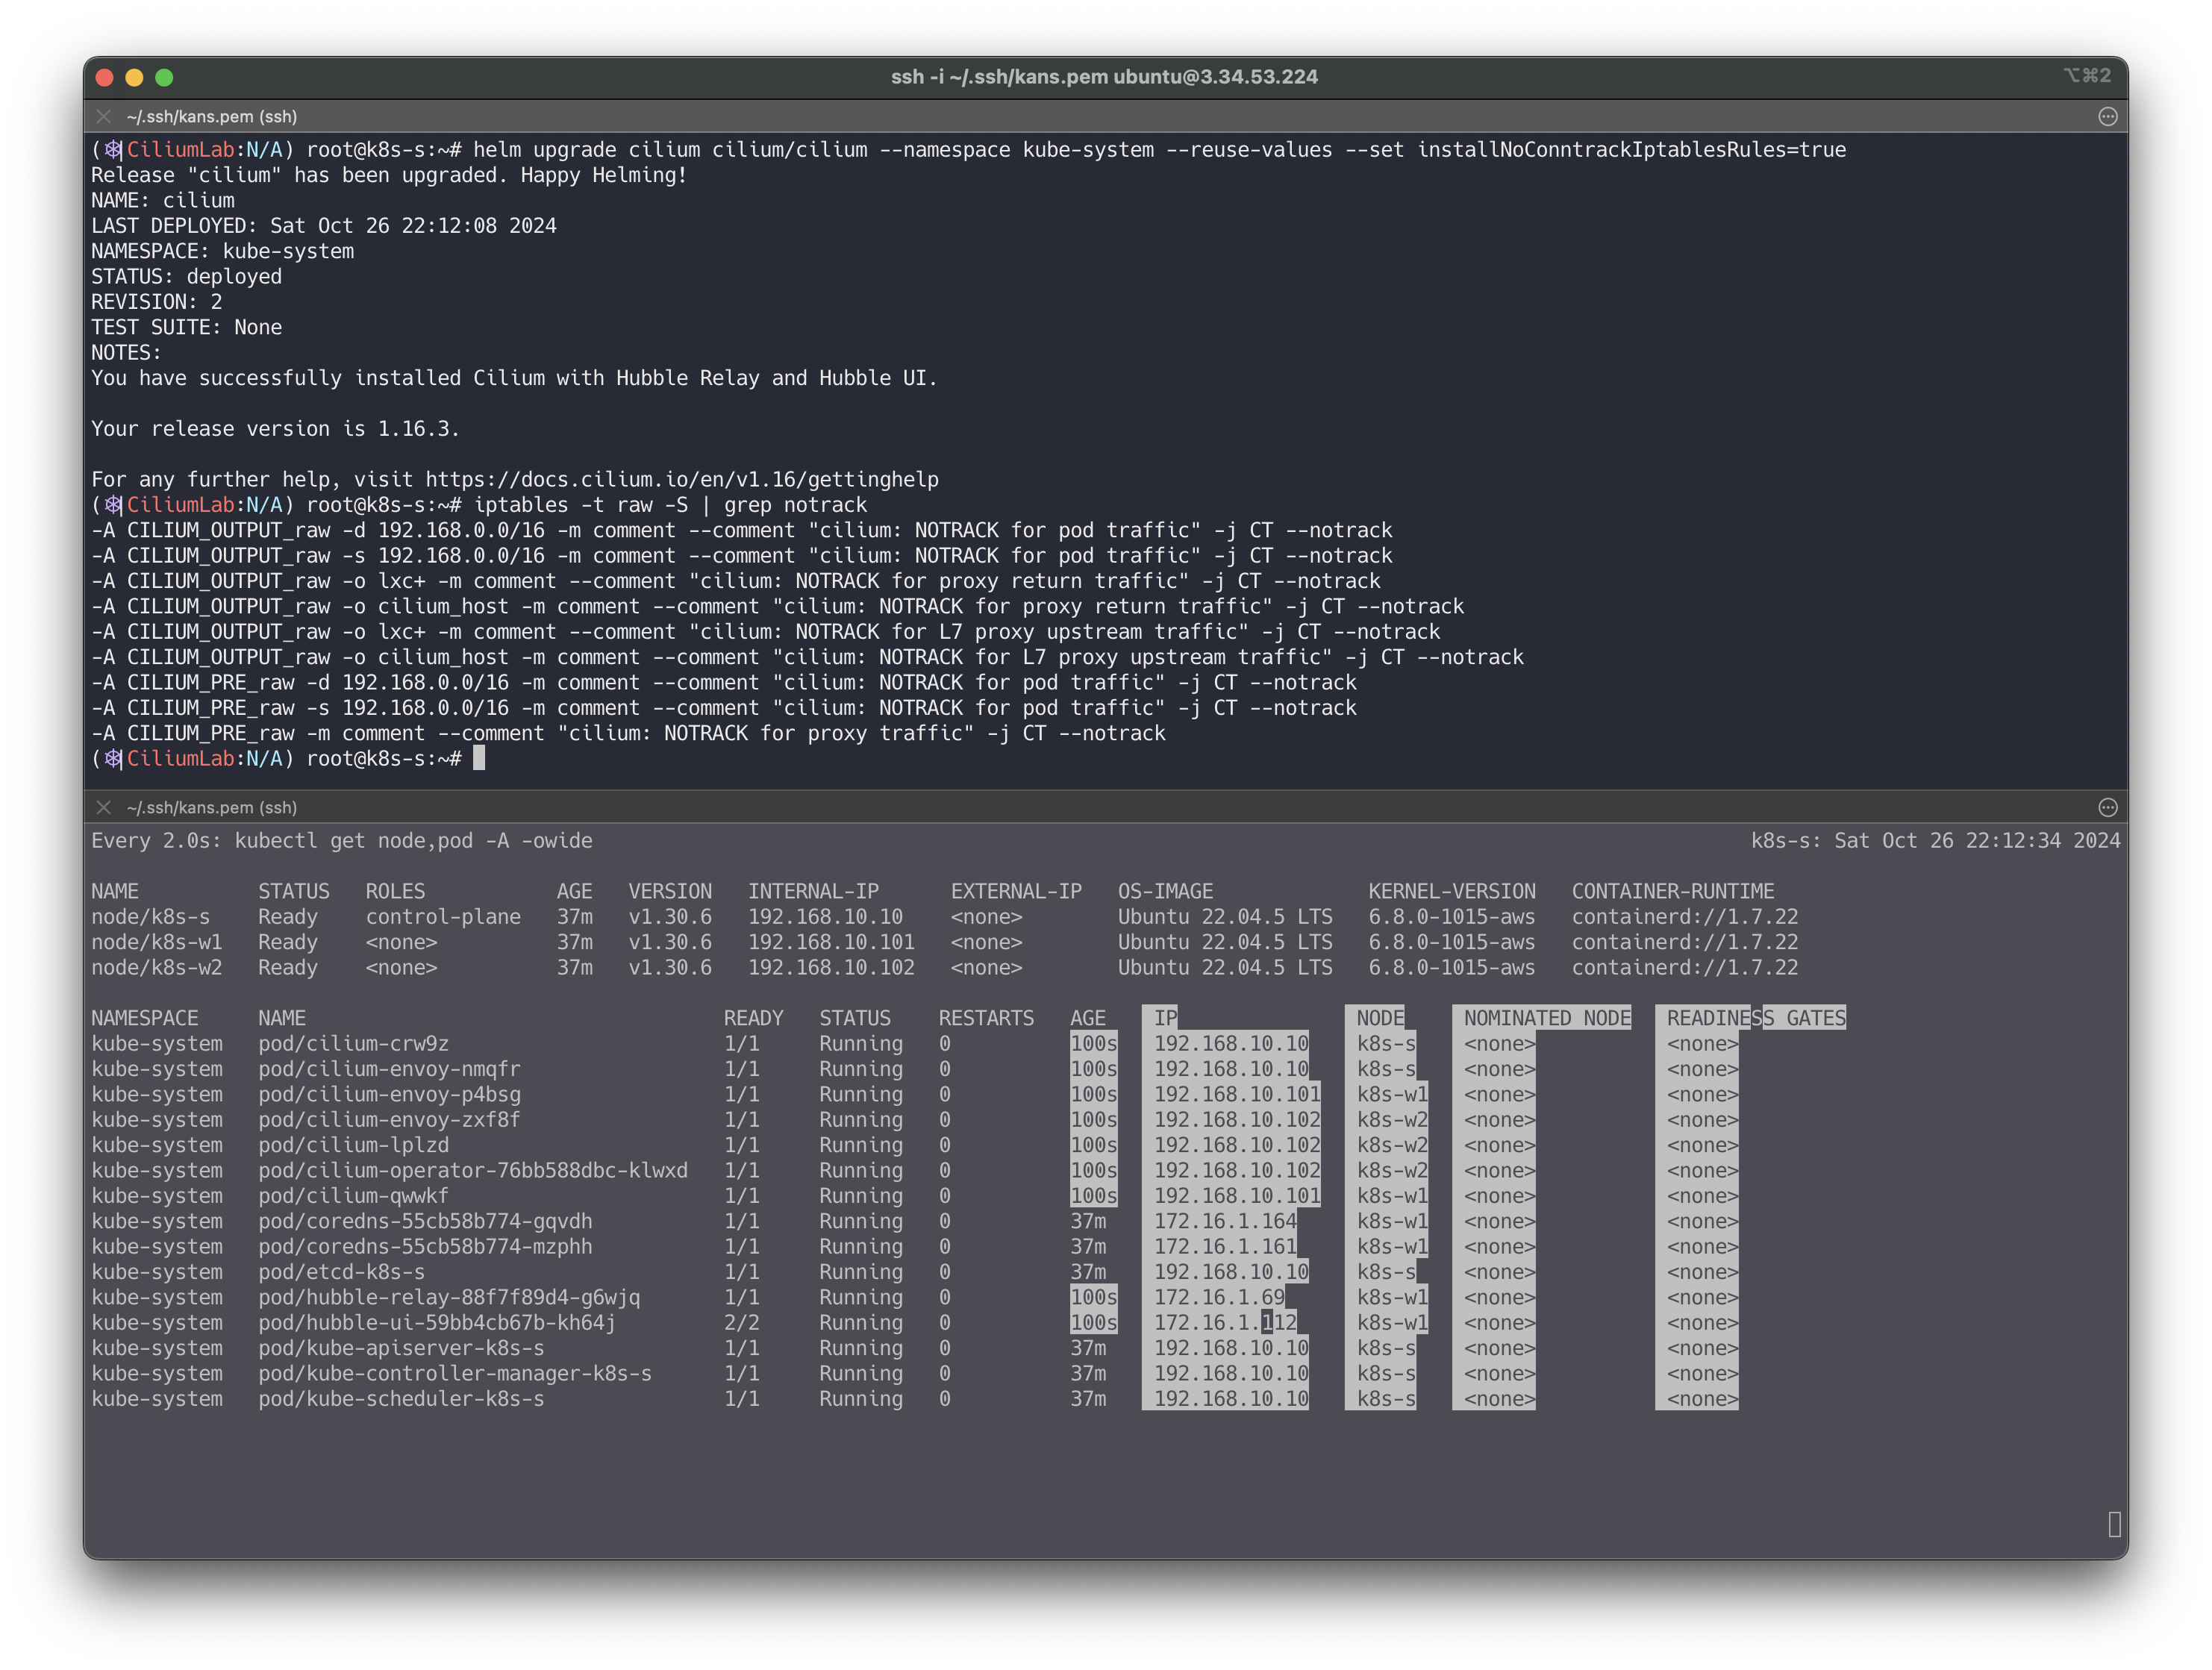
# 모니터링
watch -d kubectl get node,pod -A -owide

#
helm repo add cilium https://helm.cilium.io/
helm repo update

#
helm install cilium cilium/cilium --version 1.16.3 --namespace kube-system \
--set k8sServiceHost=192.168.10.10 --set k8sServicePort=6443 --set debug.enabled=true \
--set rollOutCiliumPods=true --set routingMode=native --set autoDirectNodeRoutes=true \
--set bpf.masquerade=true --set bpf.hostRouting=true --set endpointRoutes.enabled=true \
--set ipam.mode=kubernetes --set k8s.requireIPv4PodCIDR=true --set kubeProxyReplacement=true \
--set ipv4NativeRoutingCIDR=192.168.0.0/16 --set installNoConntrackIptablesRules=true \
--set hubble.ui.enabled=true --set hubble.relay.enabled=true --set prometheus.enabled=true --set operator.prometheus.enabled=true --set hubble.metrics.enableOpenMetrics=true \
--set hubble.metrics.enabled="{dns:query;ignoreAAAA,drop,tcp,flow,port-distribution,icmp,httpV2:exemplars=true;labelsContext=source_ip\,source_namespace\,source_workload\,destination_ip\,destination_namespace\,destination_workload\,traffic_direction}" \
--set operator.replicas=1

## 주요 파라미터 설명
--set debug.enabled=true # cilium 파드에 로그 레벨을 debug 설정
--set autoDirectNodeRoutes=true # 동일 대역 내의 노드들 끼리는 상대 노드의 podCIDR 대역의 라우팅이 자동으로 설정
--set endpointRoutes.enabled=true # 호스트에 endpoint(파드)별 개별 라우팅 설정
--set hubble.relay.enabled=true --set hubble.ui.enabled=true # hubble 활성화
--set ipam.mode=kubernetes --set k8s.requireIPv4PodCIDR=true # k8s IPAM 활용
--set kubeProxyReplacement=true # kube-proxy 없이 (최대한) 대처할수 있수 있게
--set ipv4NativeRoutingCIDR=192.168.0.0/16 # 해당 대역과 통신 시 IP Masq 하지 않음, 보통 사내망 대역을 지정
--set operator.replicas=1 # cilium-operator 파드 기본 1개
--set enableIPv4Masquerade=true --set bpf.masquerade=true # 파드를 위한 Masquerade , 추가로 Masquerade 을 BPF 로 처리 >> enableIPv4Masquerade=true 인 상태에서 추가로 bpf.masquerade=true 적용이 가능

# 설정 및 확인
ip -c addr
kubectl get node,pod,svc -A -owide
iptables -t nat -S
iptables -t filter -S
iptables -t raw -S
iptables -t mangle -S
conntrack -L

kubectl get crd
kubectl get ciliumnodes # cilium_host 인터페이스의 IP 확인 : CILIUMINTERNALIP
kubectl get ciliumendpoints -A

kubectl get cm -n kube-system cilium-config -o json | jq

kubetail -n kube-system -l k8s-app=cilium --since 1h
kubetail -n kube-system -l k8s-app=cilium-envoy --since 1h

# Native XDP 지원 NIC 확인 : https://docs.cilium.io/en/stable/bpf/progtypes/#xdp-drivers
ethtool -i ens5
driver: ena
version: 6.8.0-1015-aws
...

# https://docs.cilium.io/en/stable/operations/performance/tuning/#bypass-iptables-connection-tracking
watch -d kubectl get pod -A # 모니터링
helm upgrade cilium cilium/cilium --namespace kube-system --reuse-values --set installNoConntrackIptablesRules=true

# 확인: 기존 raw 에 아래 rule 추가 확인
iptables -t raw -S | grep notrack
-A CILIUM_OUTPUT_raw -d 192.168.0.0/16 -m comment --comment "cilium: NOTRACK for pod traffic" -j CT --notrack
-A CILIUM_OUTPUT_raw -s 192.168.0.0/16 -m comment --comment "cilium: NOTRACK for pod traffic" -j CT --notrack
...

conntrack -F
conntrack -L
conntrack -L |grep -v 2379
Cilium CLI 설치 : inspect the state of a Cilium installation, and enable/disable various features (e.g. clustermesh, Hubble) - Link
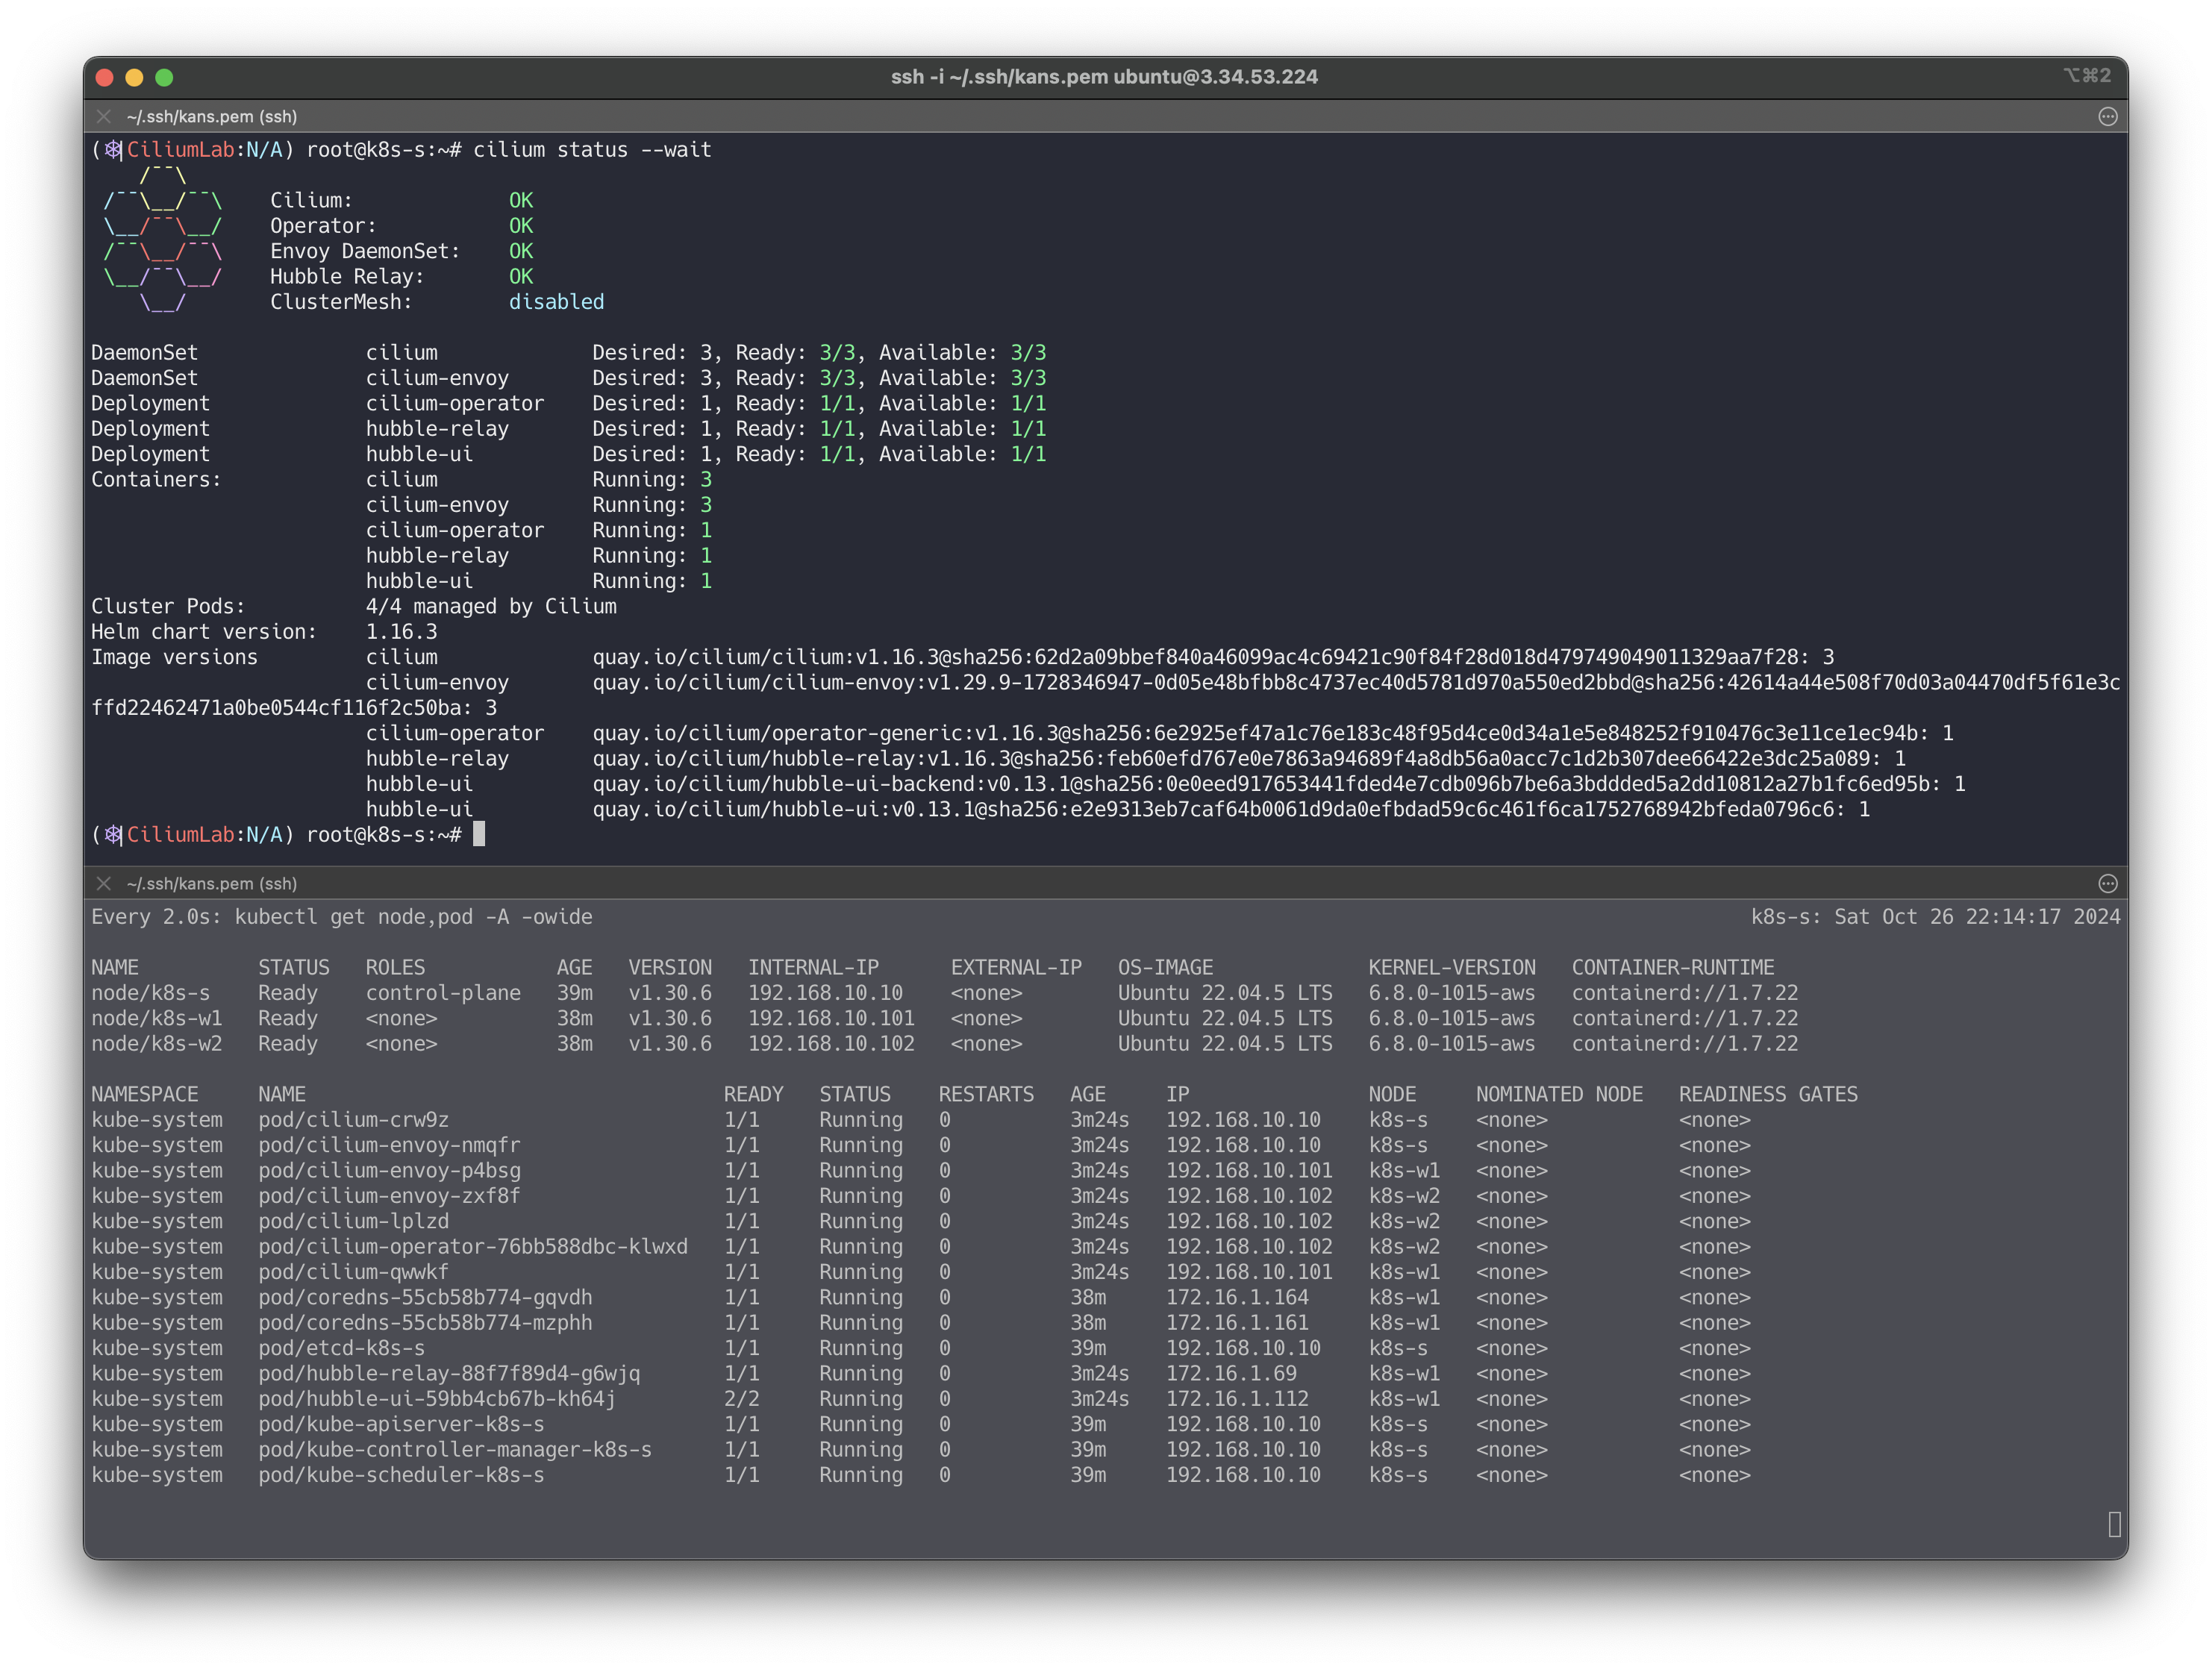
# Cilium CLI 설치
CILIUM_CLI_VERSION=$(curl -s https://raw.githubusercontent.com/cilium/cilium-cli/main/stable.txt)
CLI_ARCH=amd64
if [ "$(uname -m)" = "aarch64" ]; then CLI_ARCH=arm64; fi
curl -L --fail --remote-name-all https://github.com/cilium/cilium-cli/releases/download/${CILIUM_CLI_VERSION}/cilium-linux-${CLI_ARCH}.tar.gz{,.sha256sum}
sha256sum --check cilium-linux-${CLI_ARCH}.tar.gz.sha256sum
sudo tar xzvfC cilium-linux-${CLI_ARCH}.tar.gz /usr/local/bin
rm cilium-linux-${CLI_ARCH}.tar.gz{,.sha256sum}

# 확인
cilium status --wait
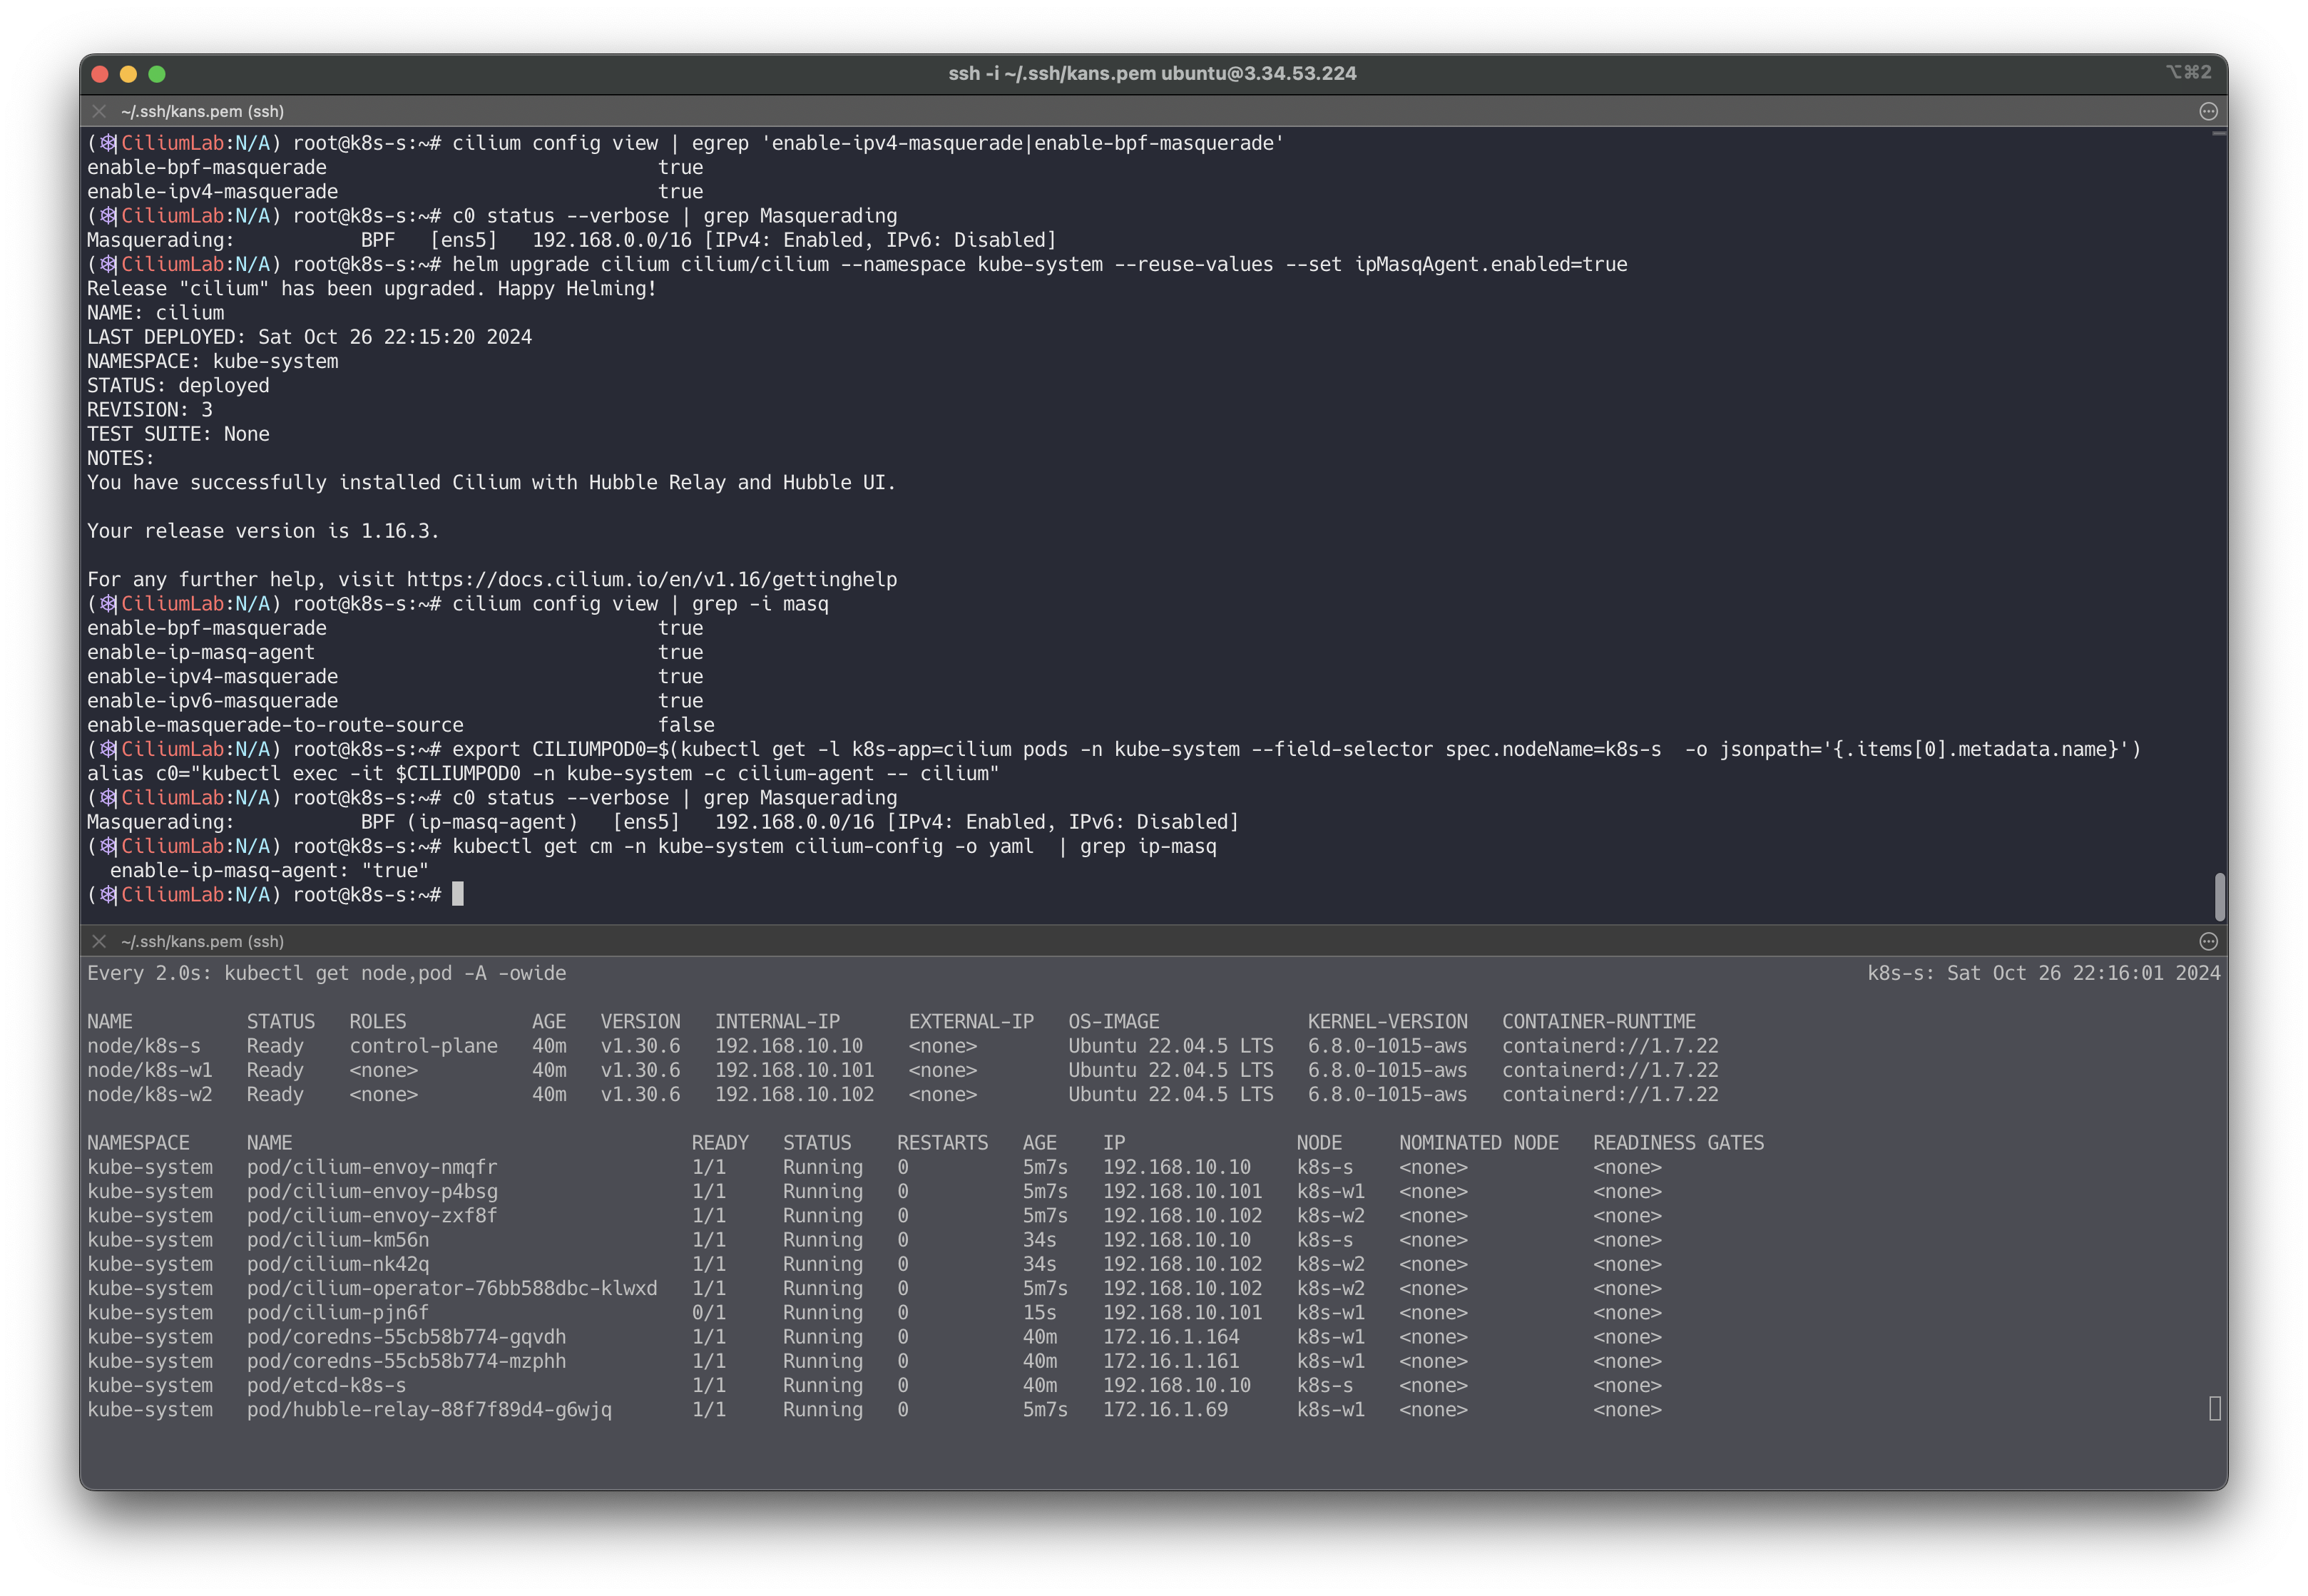
cilium config view

# cilium 데몬셋 파드 내에서 cilium 명령어로 상태 확인
export CILIUMPOD0=$(kubectl get -l k8s-app=cilium pods -n kube-system --field-selector spec.nodeName=k8s-s  -o jsonpath='{.items[0].metadata.name}')
alias c0="kubectl exec -it $CILIUMPOD0 -n kube-system -c cilium-agent -- cilium"
c0 status --verbose
...
KubeProxyReplacement:   True   [ens5   192.168.10.10 fe80::57:abff:fee3:da8d (Direct Routing)]
...
IPAM:                   IPv4: 2/254 allocated from 172.16.0.0/24,
Allocated addresses:
  172.16.0.159 (router)
  172.16.0.171 (health)
...
Routing:                Network: Native   Host: BPF
...
Device Mode:            veth
Masquerading:           BPF   [ens5]   192.168.0.0/16 [IPv4: Enabled, IPv6: Disabled]
...
Proxy Status:            OK, ip 172.16.0.159, 0 redirects active on ports 10000-20000, Envoy: external
...
KubeProxyReplacement Details:
  Status:                 True
  Socket LB:              Enabled
  Socket LB Tracing:      Enabled
  Socket LB Coverage:     Full
  Devices:                ens5   192.168.10.10 fe80::57:abff:fee3:da8d (Direct Routing)
  Mode:                   SNAT
  Backend Selection:      Random
  Session Affinity:       Enabled
  Graceful Termination:   Enabled
  NAT46/64 Support:       Disabled
  XDP Acceleration:       Disabled
  Services:
  - ClusterIP:      Enabled
  - NodePort:       Enabled (Range: 30000-32767)
  - LoadBalancer:   Enabled
  - externalIPs:    Enabled
  - HostPort:       Enabled
BPF Maps:   dynamic sizing: on (ratio: 0.002500)
...

# Native Routing 확인 : # 192.168.0.0/16 대역은 IP Masq 없이 라우팅
c0 status | grep KubeProxyReplacement
ubeProxyReplacement:    True   [ens5   192.168.10.10 fe80::57:abff:fee3:da8d (Direct Routing)]

# enableIPv4Masquerade=true(기본값) , bpf.masquerade=true 확인
cilium config view | egrep 'enable-ipv4-masquerade|enable-bpf-masquerade'
enable-bpf-masquerade                          true
enable-ipv4-masquerade                         true

c0 status --verbose | grep Masquerading
Masquerading:           BPF   [ens5]   192.168.0.0/16 [IPv4: Enabled, IPv6: Disabled]

# Configure the eBPF-based ip-masq-agent
# https://docs.cilium.io/en/stable/network/concepts/masquerading/
helm upgrade cilium cilium/cilium --namespace kube-system --reuse-values --set ipMasqAgent.enabled=true

#
cilium config view | grep -i masq
enable-bpf-masquerade                             true
enable-ip-masq-agent                              true
...

export CILIUMPOD0=$(kubectl get -l k8s-app=cilium pods -n kube-system --field-selector spec.nodeName=k8s-s  -o jsonpath='{.items[0].metadata.name}')
alias c0="kubectl exec -it $CILIUMPOD0 -n kube-system -c cilium-agent -- cilium"
c0 status --verbose | grep Masquerading
Masquerading:           BPF (ip-masq-agent)   [ens5]   192.168.0.0/16 [IPv4: Enabled, IPv6: Disabled]

kubectl get cm -n kube-system cilium-config -o yaml  | grep ip-masq
  enable-ip-masq-agent: "true"
✅ 기본 정보 확인
변수 & 단축키
# cilium 파드 이름
export CILIUMPOD0=$(kubectl get -l k8s-app=cilium pods -n kube-system --field-selector spec.nodeName=k8s-s  -o jsonpath='{.items[0].metadata.name}')
export CILIUMPOD1=$(kubectl get -l k8s-app=cilium pods -n kube-system --field-selector spec.nodeName=k8s-w1 -o jsonpath='{.items[0].metadata.name}')
export CILIUMPOD2=$(kubectl get -l k8s-app=cilium pods -n kube-system --field-selector spec.nodeName=k8s-w2 -o jsonpath='{.items[0].metadata.name}')

# 단축키(alias) 지정
alias c0="kubectl exec -it $CILIUMPOD0 -n kube-system -c cilium-agent -- cilium"
alias c1="kubectl exec -it $CILIUMPOD1 -n kube-system -c cilium-agent -- cilium"
alias c2="kubectl exec -it $CILIUMPOD2 -n kube-system -c cilium-agent -- cilium"

alias c0bpf="kubectl exec -it $CILIUMPOD0 -n kube-system -c cilium-agent -- bpftool"
alias c1bpf="kubectl exec -it $CILIUMPOD1 -n kube-system -c cilium-agent -- bpftool"
alias c2bpf="kubectl exec -it $CILIUMPOD2 -n kube-system -c cilium-agent -- bpftool"

# Hubble UI 웹 접속
kubectl patch -n kube-system svc hubble-ui -p '{"spec": {"type": "NodePort"}}'
HubbleUiNodePort=$(kubectl get svc -n kube-system hubble-ui -o jsonpath={.spec.ports[0].nodePort})
echo -e "Hubble UI URL = http://$(curl -s ipinfo.io/ip):$HubbleUiNodePort"

# 자주 사용 명령
helm upgrade cilium cilium/cilium --namespace kube-system --reuse-values --set
kubetail -n kube-system -l k8s-app=cilium --since 12h
kubetail -n kube-system -l k8s-app=cilium-envoy --since 12h
자주 쓰는 Cilium CLI 명령어
# cilium 파드 확인
kubectl get pod -n kube-system -l k8s-app=cilium -owide

# cilium 파드 재시작
kubectl -n kube-system rollout restart ds/cilium
혹은
kubectl delete pod -n kube-system -l k8s-app=cilium

# cilium 설정 정보 확인
cilium config view

# cilium 파드의 cilium 상태 확인
c0 status --verbose

# cilium 엔드포인트 확인
kubectl get ciliumendpoints -A
c0 endpoint list
c0 bpf endpoint list
c0 map get cilium_lxc
c0 ip list

# Manage the IPCache mappings for IP/CIDR <-> Identity
c0 bpf ipcache list

# Service/NAT List 확인
c0 service list
c0 bpf lb list
c0 bpf lb list --revnat
c0 bpf nat list

# List all open BPF maps
c0 map list
c0 map list --verbose

# List contents of a policy BPF map : Dump all policy maps
c0 bpf policy get --all
c0 bpf policy get --all -n

# cilium monitor
c0 monitor -v
c0 monitor -v --type l7
Cilium 기본 정보 확인
# cilium 버전 확인
cilium version

# cilium 상태 확인
cilium status

# kube-proxy 파드 확인 >> 없다!
kubectl get pod -A

# cilium 설정 정보 확인
kubectl get cm -n kube-system cilium-config -o yaml
cilium config view

# ciliumnodes(cn) 정보 확인
kubectl get cn
kubectl get cn k8s-m -o yaml

# 노드별 파드 대역 확인
kubectl get ciliumnodes -o yaml | grep podCIDRs -A1

# cilium 파드 확인
kubectl get pod -n kube-system -l k8s-app=cilium -owide

# cilium 엔드포인트 확인
kubectl get ciliumendpoints.cilium.io -A

--------------------------------------------
# cilium cli 도움말
c0 help

# cilium 파드의 cilium 상태 확인
c0 status
c1 status
c2 status
c0 status --verbose

# 각 노드에서 파드에 할당된 IP 확인
c0 status --verbose | grep Allocated -A5
c1 status --verbose | grep Allocated -A5
c2 status --verbose | grep Allocated -A5

# 엔드포인트 리스트 : ID, 정책, 라벨, IP 주소, 상태 확인
c2 endpoint list

# 노드 리스트
c0 node list

# BFP(Direct access to local BPF maps)
# BFP 터널 리스트 확인 : Overlay Mode 사용 시 터널 정보 출력
c0 bpf tunnel list
	TUNNEL         VALUE
	172.16.1.0:0   192.168.200.101:0
	172.16.2.0:0   192.168.200.102:0
c1 bpf tunnel list
	TUNNEL         VALUE
	172.16.2.0:0   192.168.200.102:0
	172.16.0.0:0   192.168.200.10:0
c2 bpf tunnel list
	TUNNEL         VALUE
	172.16.0.0:0   192.168.200.10:0
	172.16.1.0:0   192.168.200.101:0

# 해당 노드의 로컬 엔드포인트 리스트 : nodemac 은 해당 파드와 veth pair 인 인터페이스의 mac 주소이다!
c0 bpf endpoint list

# Connection tracking tables - List connection tracking entries
c0 bpf ct list global

# Flush all NAT mapping entries
c0 bpf nat flush

# List all NAT mapping entries
c0 bpf nat list

# service list 확인, Frontend 는 Service IP, Backend 는 Pod IP(endpoint IP)를 보여준다.
c0 service list

# List load-balancing configuration
c0 bpf lb list

# List reverse NAT entries
c0 bpf lb list --revnat

# List all open BPF maps
c0 map list
c0 map list --verbose
c0 map get cilium_lxc
c0 map get cilium_ipcache

# cilium monitor
c0 monitor -h
c0 monitor -v
c0 monitor -v --type l7

# Cilium will automatically mount cgroup v2 filesystem required to attach BPF cgroup programs by default at the path /run/cilium/cgroupv2
mount | grep cilium
tree /run/cilium/cgroupv2/ -L 1

# CNI Plugin 확인
tree /etc/cni/net.d/
cat /etc/cni/net.d/05-cilium.conf

# Manage IP addresses and associated information - IP List
c0 ip list

# IDENTITY :  1(host), 2(world), 4(health), 6(remote), 파드마다 개별 ID를 가지는 것으로 보인다!
c0 ip list -n

# 엔드포인트 설정 확인 및 변경
c0 endpoint config <엔트포인트ID>

# 엔드포인트 상세 정보 확인
c0 endpoint get <엔트포인트ID>

# 엔드포인트 로그 확인
c0 endpoint log <엔트포인트ID>

# Show bpf filesystem mount details
c0 bpf fs show

# bfp 마운트 폴더 확인
tree /sys/fs/bpf

# List contents of a policy BPF map : Dump all policy maps
c0 bpf policy get --all
c0 bpf policy get --all -n

# BPF datapath traffic metrics
c0 bpf metrics list

# Manage the IPCache mappings for IP/CIDR <-> Identity
c0 bpf ipcache list

# Manage compiled BPF template objects
c0 bpf sha list

# Get datapath SHA header
c0 bpf sha get <Datapath SHA>

# Retrieve information about an identity
c0 identity list

# 엔드포인트 기준 ID
c0 identity list --endpoints

# Access metric status
c0 metrics list
네트워크 기본 정보 확인 : k8s-w1/w2 에 SSH 접속 후 ip -c link/route 정보 확인
http://arthurchiao.art/blog/ctrip-network-arch-evolution/
# 네트워크 인터페이스 정보 확인
ip -br -c link
ip -br -c addr

--------------------------------------------
# cilium_net 과 cilium_host 는 veth peer 관계이며, cilium_host 는 파드의 GW IP 주소로 지정되며 32bit 이다
ip -c addr show cilium_net ; ip -c addr show cilium_host
	5: cilium_net@cilium_host: <BROADCAST,MULTICAST,NOARP,UP,LOWER_UP> mtu 1500 qdisc noqueue state UP group default qlen 1000
	    link/ether 36:88:bf:c9:5c:6c brd ff:ff:ff:ff:ff:ff
	   ...
	6: cilium_host@cilium_net: <BROADCAST,MULTICAST,NOARP,UP,LOWER_UP> mtu 1500 qdisc noqueue state UP group default qlen 1000
	    link/ether 4e:6a:8e:44:85:61 brd ff:ff:ff:ff:ff:ff
	    inet 172.16.1.254/32 scope link cilium_host
   ...

# proxy arp 는 disable(0) 상태이며, 파드와 연결된 lxc 도 모두 0 이다
# 파드의 32bit ip의 gw 가 각각 연결된 veth 인터페이스의 mac 으로 cilium_host 의 IP/MAC 응답을 처리한다, 어떻게 동작이 되는걸까요? >> eBPF program!!!
cat /proc/sys/net/ipv4/conf/cilium_net/proxy_arp
0
cat /proc/sys/net/ipv4/conf/cilium_host/proxy_arp
0

# lxc_health 인터페이스는 veth 로 cilium(NET NS 0, 호스트와 다름)과 veth pair 이다 - 링크
# cilium 인터페이스에 파드 IP가 할당되어 있으며, cilium-health-responder 로 동작한다
lsns -t net
✅ Hubble UI & CLI
Observability
- Network Observability with Hubble - Link
- Running Prometheus & Grafana - Link
- Monitoring & Metrics - Link
- Layer 7 Protocol Visibility - Link
- Hubble for Network Observability and Security (Part 3): Leveraging Hubble Data for Network Security - Link
- Hubble for Network Observability and Security (Part 2): Utilizing Hubble for Network Observability - Link
- Hubble for Network Observability and Security (Part 1): Introduction to Cilium and Hubble - Link
Hubble 소개 : 통신 및 서비스와 네트워킹 인프라의 동작에 대한 심층적인 가시성을 완전히 투명한 방식으로 제공하는 관찰성을 제공 - Blog
-
Hubble is a fully distributed networking and security observability platform. → 네트워크/보안 모니터링
-
It is built on top of Cilium and eBPF to enable deep visibility into the communication and behavior of services as well as the networking infrastructure in a completely transparent manner. without requiring the application to change in any way. → 애플리케이션의 코드 수정 등 추가 설정 없이 동작
-
containerized workloads as well as more traditional workloads such as virtual machines and standard Linux processes. → VM/서버도 모니터링 가능
-
By leveraging Linux eBPF, Cilium retains the ability to transparently insert security visibility + enforcement, but does so in a way that is based on service / pod / container identity (in contrast to IP address identification in traditional systems) and can filter on application-layer (e.g. HTTP). → 전통적인 IP 기반은 모니터링/통제가 아니라 서비스/파드/ID 기반으로 모니터링/통제를 제공
-
기본적으로 Hubble API는 Cilium 에이전트가 실행되는 개별 노드의 범위 내에서 작동합니다. 이는 네트워크 통찰력을 로컬 Cilium 에이전트가 관찰한 트래픽으로 제한합니다. Hubble CLI(
hubble)를 사용하여 로컬 Unix Domain Socket을 통해 제공된 Hubble API를 쿼리할 수 있습니다. Hubble CLI 바이너리는 기본적으로 Cilium 에이전트 포드에 설치됩니다. -
Hubble Relay를 배포하면 전체 클러스터 또는 ClusterMesh 시나리오의 여러 클러스터에 대한 네트워크 가시성이 제공됩니다. 이 모드에서 Hubble 데이터는 Hubble CLI(
hubble)를 Hubble Relay 서비스로 지정하거나 Hubble UI를 통해 액세스할 수 있습니다. Hubble UI는 L3/L4 및 L7 계층에서 서비스 종속성 그래프를 자동으로 검색할 수 있는 웹 인터페이스로, 사용자 친화적인 시각화 및 서비스 맵으로서의 데이터 흐름 필터링을 허용합니다.
Metrics export via Prometheus
Key metrics are exported via Prometheus for integration with your existing dashboards.
https://cilium.io/blog/2019/11/19/announcing-hubble
Cluster-wide observability with Hubble Relay
https://cilium.io/blog/2020/06/22/cilium-18
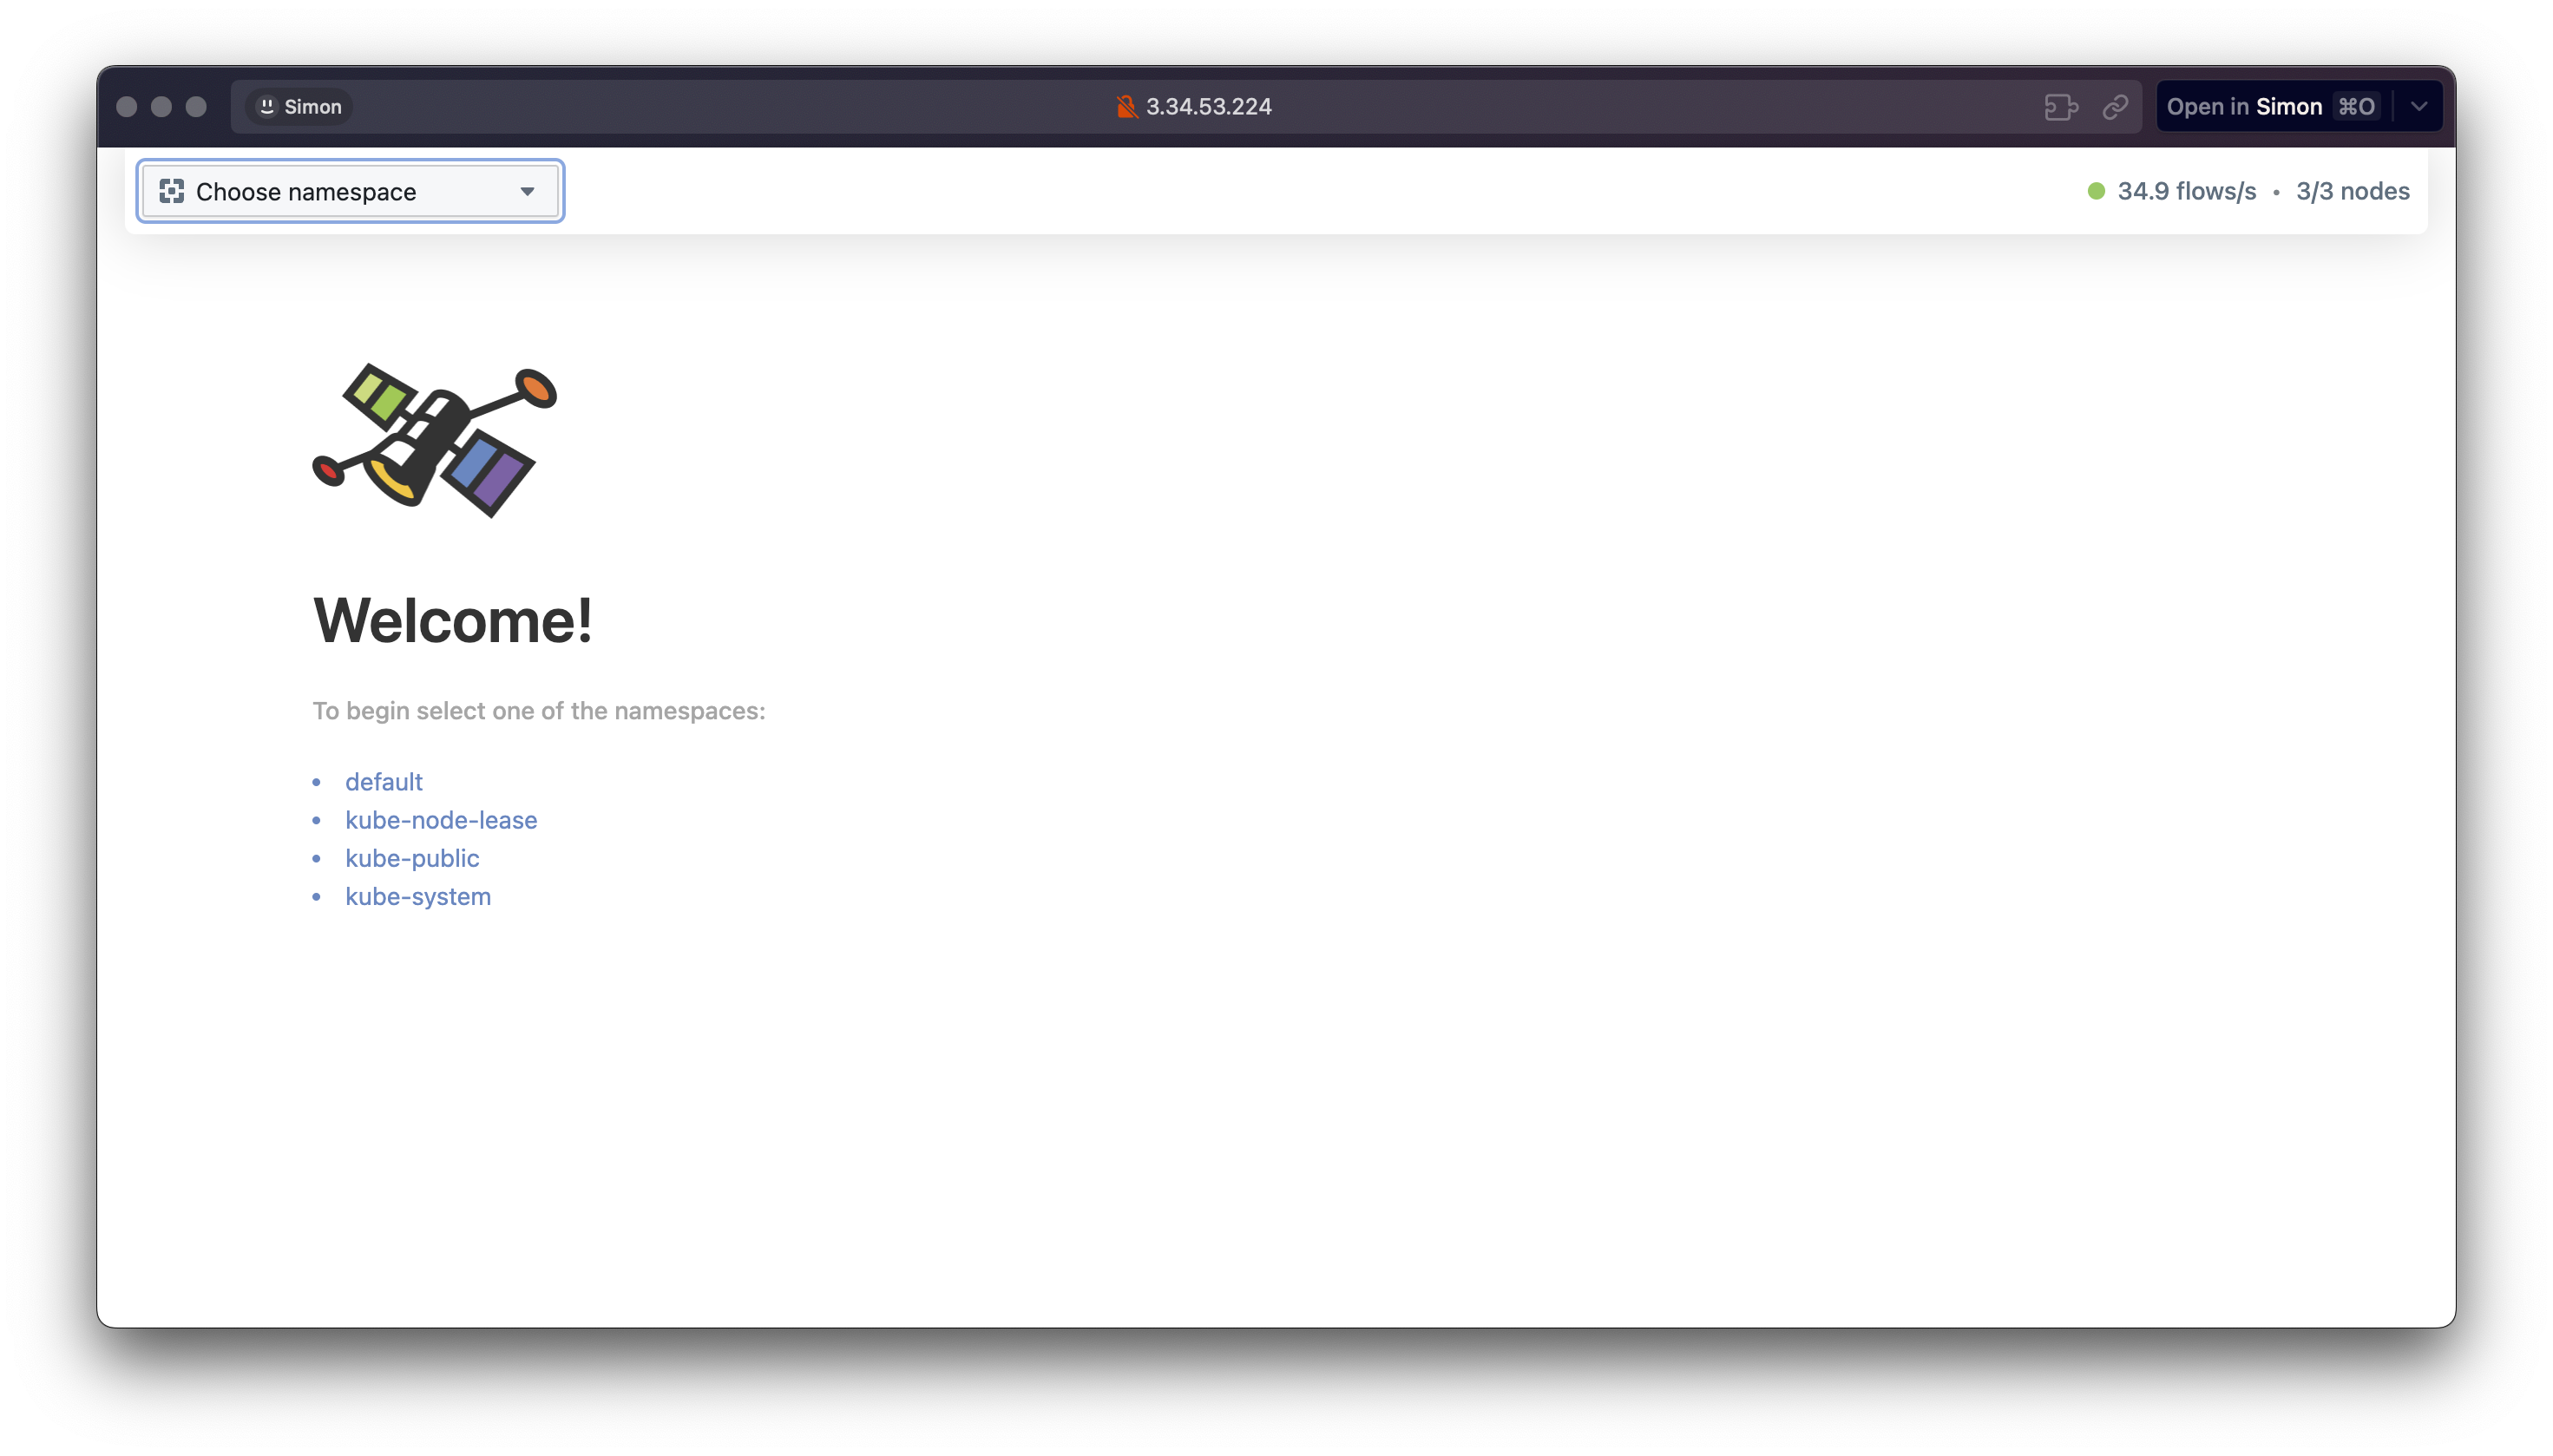
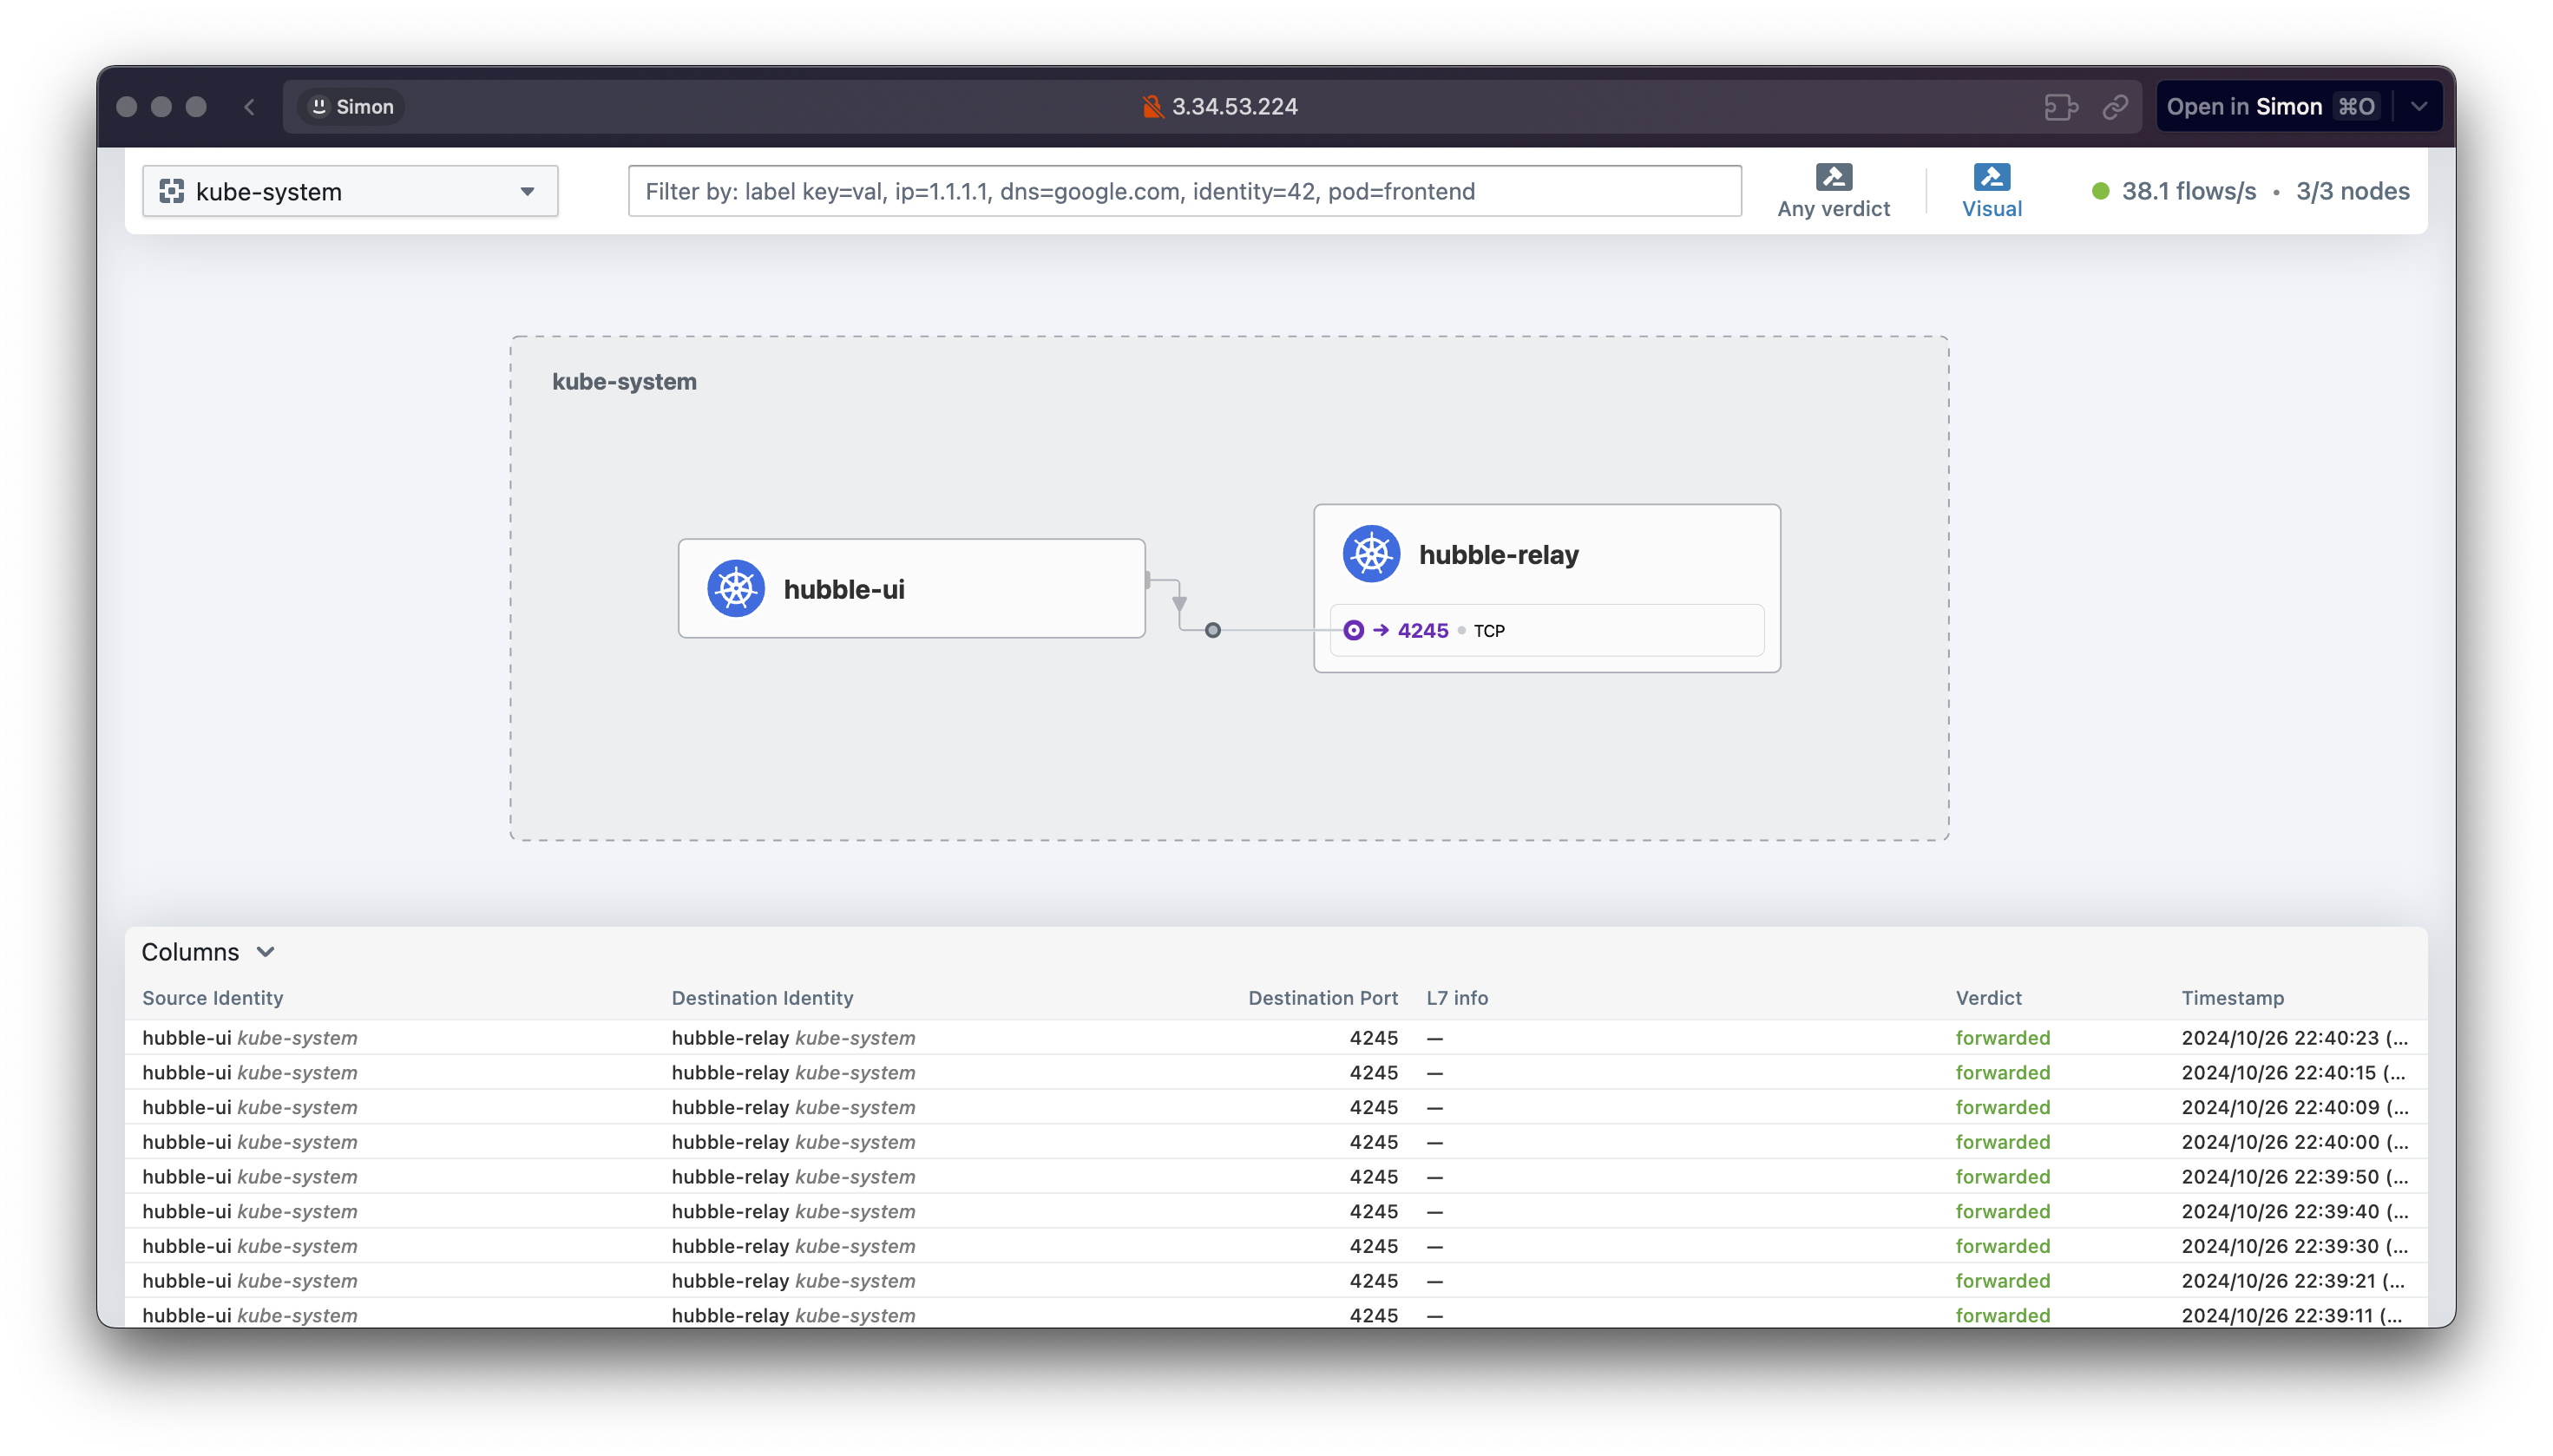
Hubble UI/CLI 접근 및 확인 - Docs
# 확인
cilium status

# UI 파드 정보 확인
kubectl get pod -n kube-system -l k8s-app=hubble-ui -o wide

# Hubble UI 웹 접속
kubectl patch -n kube-system svc hubble-ui -p '{"spec": {"type": "NodePort"}}'
HubbleUiNodePort=$(kubectl get svc -n kube-system hubble-ui -o jsonpath={.spec.ports[0].nodePort})
echo -e "Hubble UI URL = http://$(curl -s ipinfo.io/ip):$HubbleUiNodePort"

## Service NodePort 생성 후 아래 정보 확인!
iptables -t nat -S
conntrack -L
conntrack -L |grep -v 2379

# Install Hubble Client
HUBBLE_VERSION=$(curl -s https://raw.githubusercontent.com/cilium/hubble/master/stable.txt)
HUBBLE_ARCH=amd64
if [ "$(uname -m)" = "aarch64" ]; then HUBBLE_ARCH=arm64; fi
curl -L --fail --remote-name-all https://github.com/cilium/hubble/releases/download/$HUBBLE_VERSION/hubble-linux-${HUBBLE_ARCH}.tar.gz{,.sha256sum}
sha256sum --check hubble-linux-${HUBBLE_ARCH}.tar.gz.sha256sum
sudo tar xzvfC hubble-linux-${HUBBLE_ARCH}.tar.gz /usr/local/bin
rm hubble-linux-${HUBBLE_ARCH}.tar.gz{,.sha256sum}

# Hubble API Access : localhost TCP 4245 Relay 를 통해 접근, observe 를 통해서 flow 쿼리 확인 가능!
cilium hubble port-forward &

# CLI 로 Hubble API 상태 확인
hubble status

# query the flow API and look for flows
hubble observe
# hubble observe --pod netpod
# hubble observe --namespace galaxy --http-method POST --http-path /v1/request-landing
# hubble observe --pod deathstar --protocol http
# hubble observe --pod deathstar --verdict DROPPED
👉 Step 02. 노드 간 파드 통신 확인
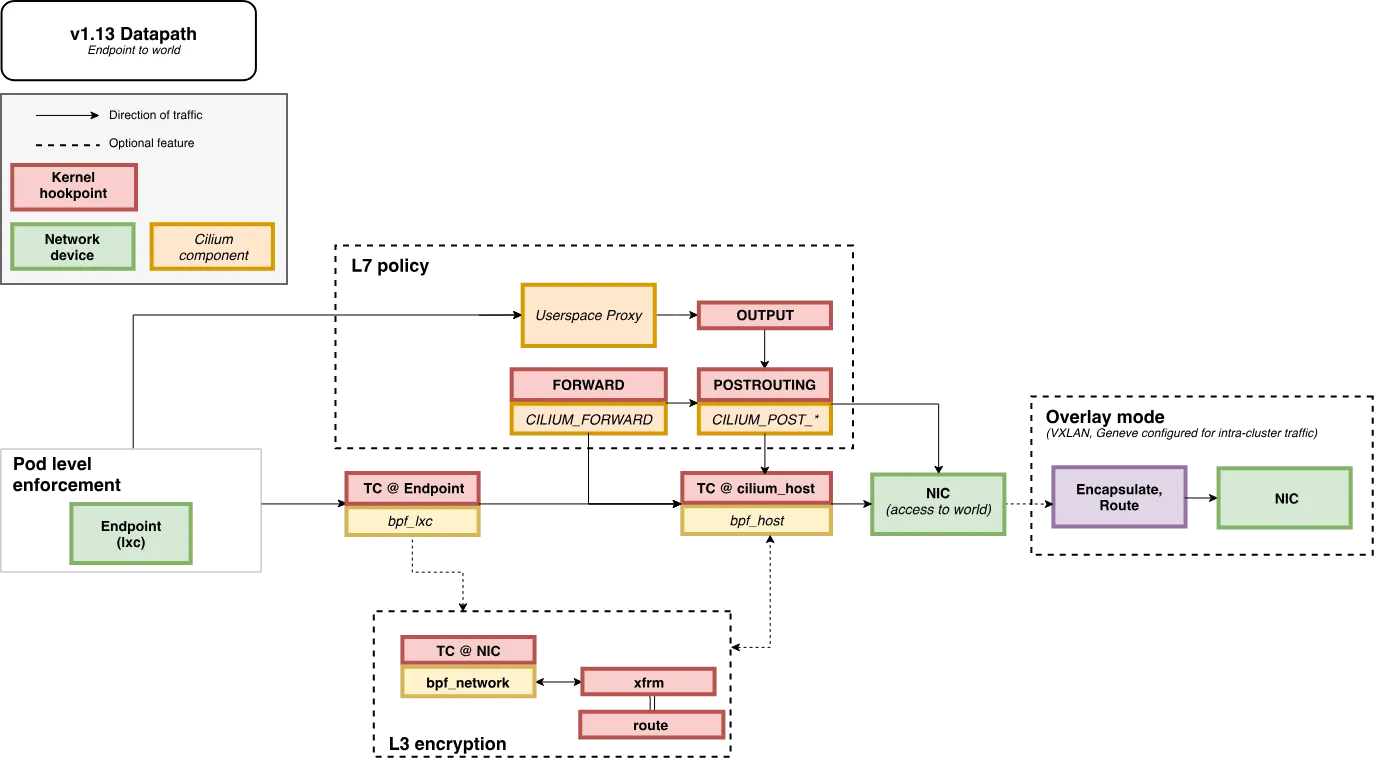
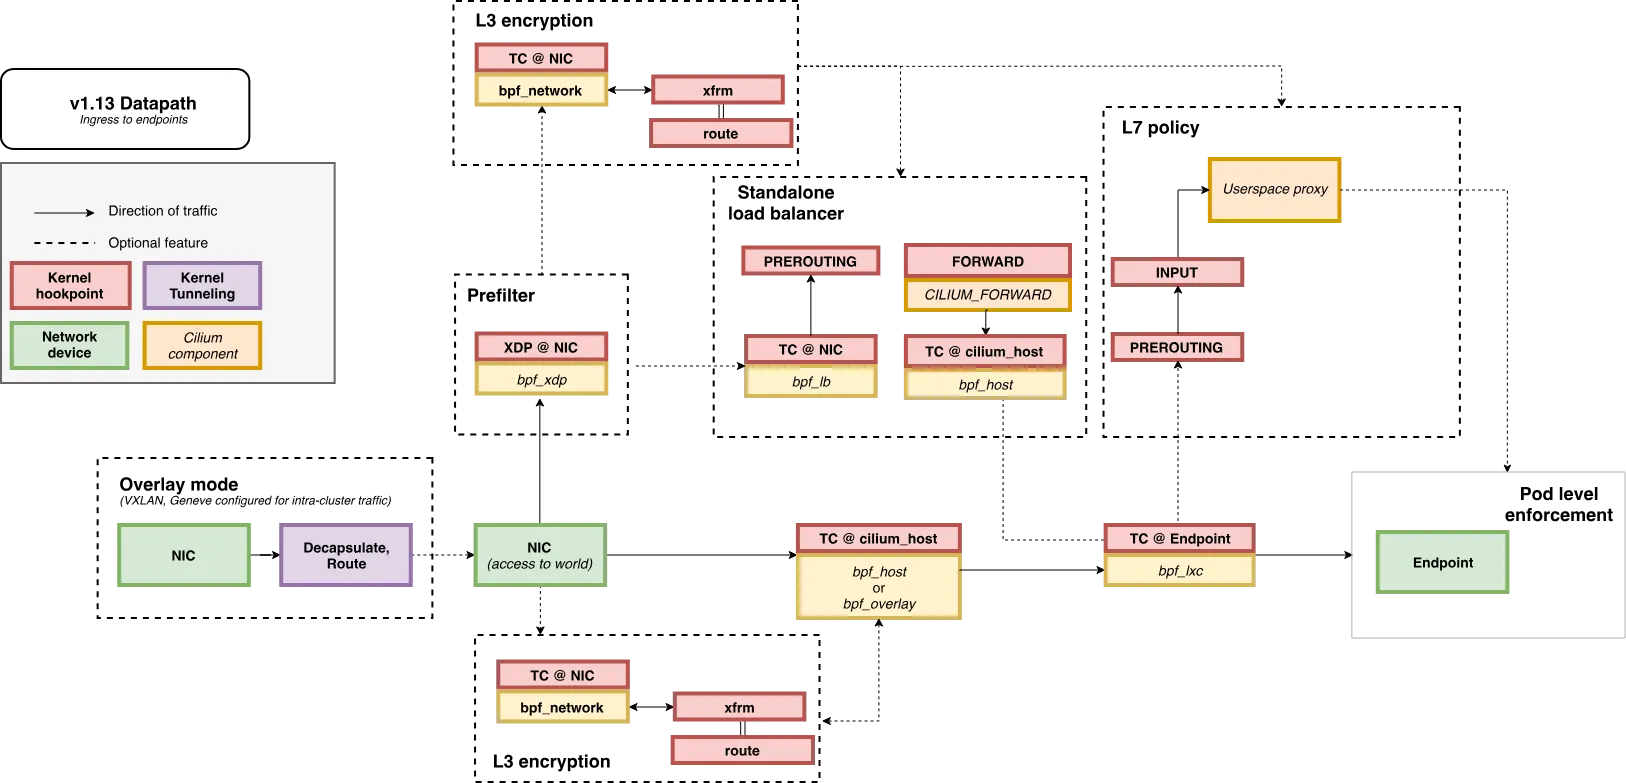
eBPF Datapath - Link
Packet Flow
- Endpoint to Endpoint
- Egress from Endpoint
- Ingress to Endpoint
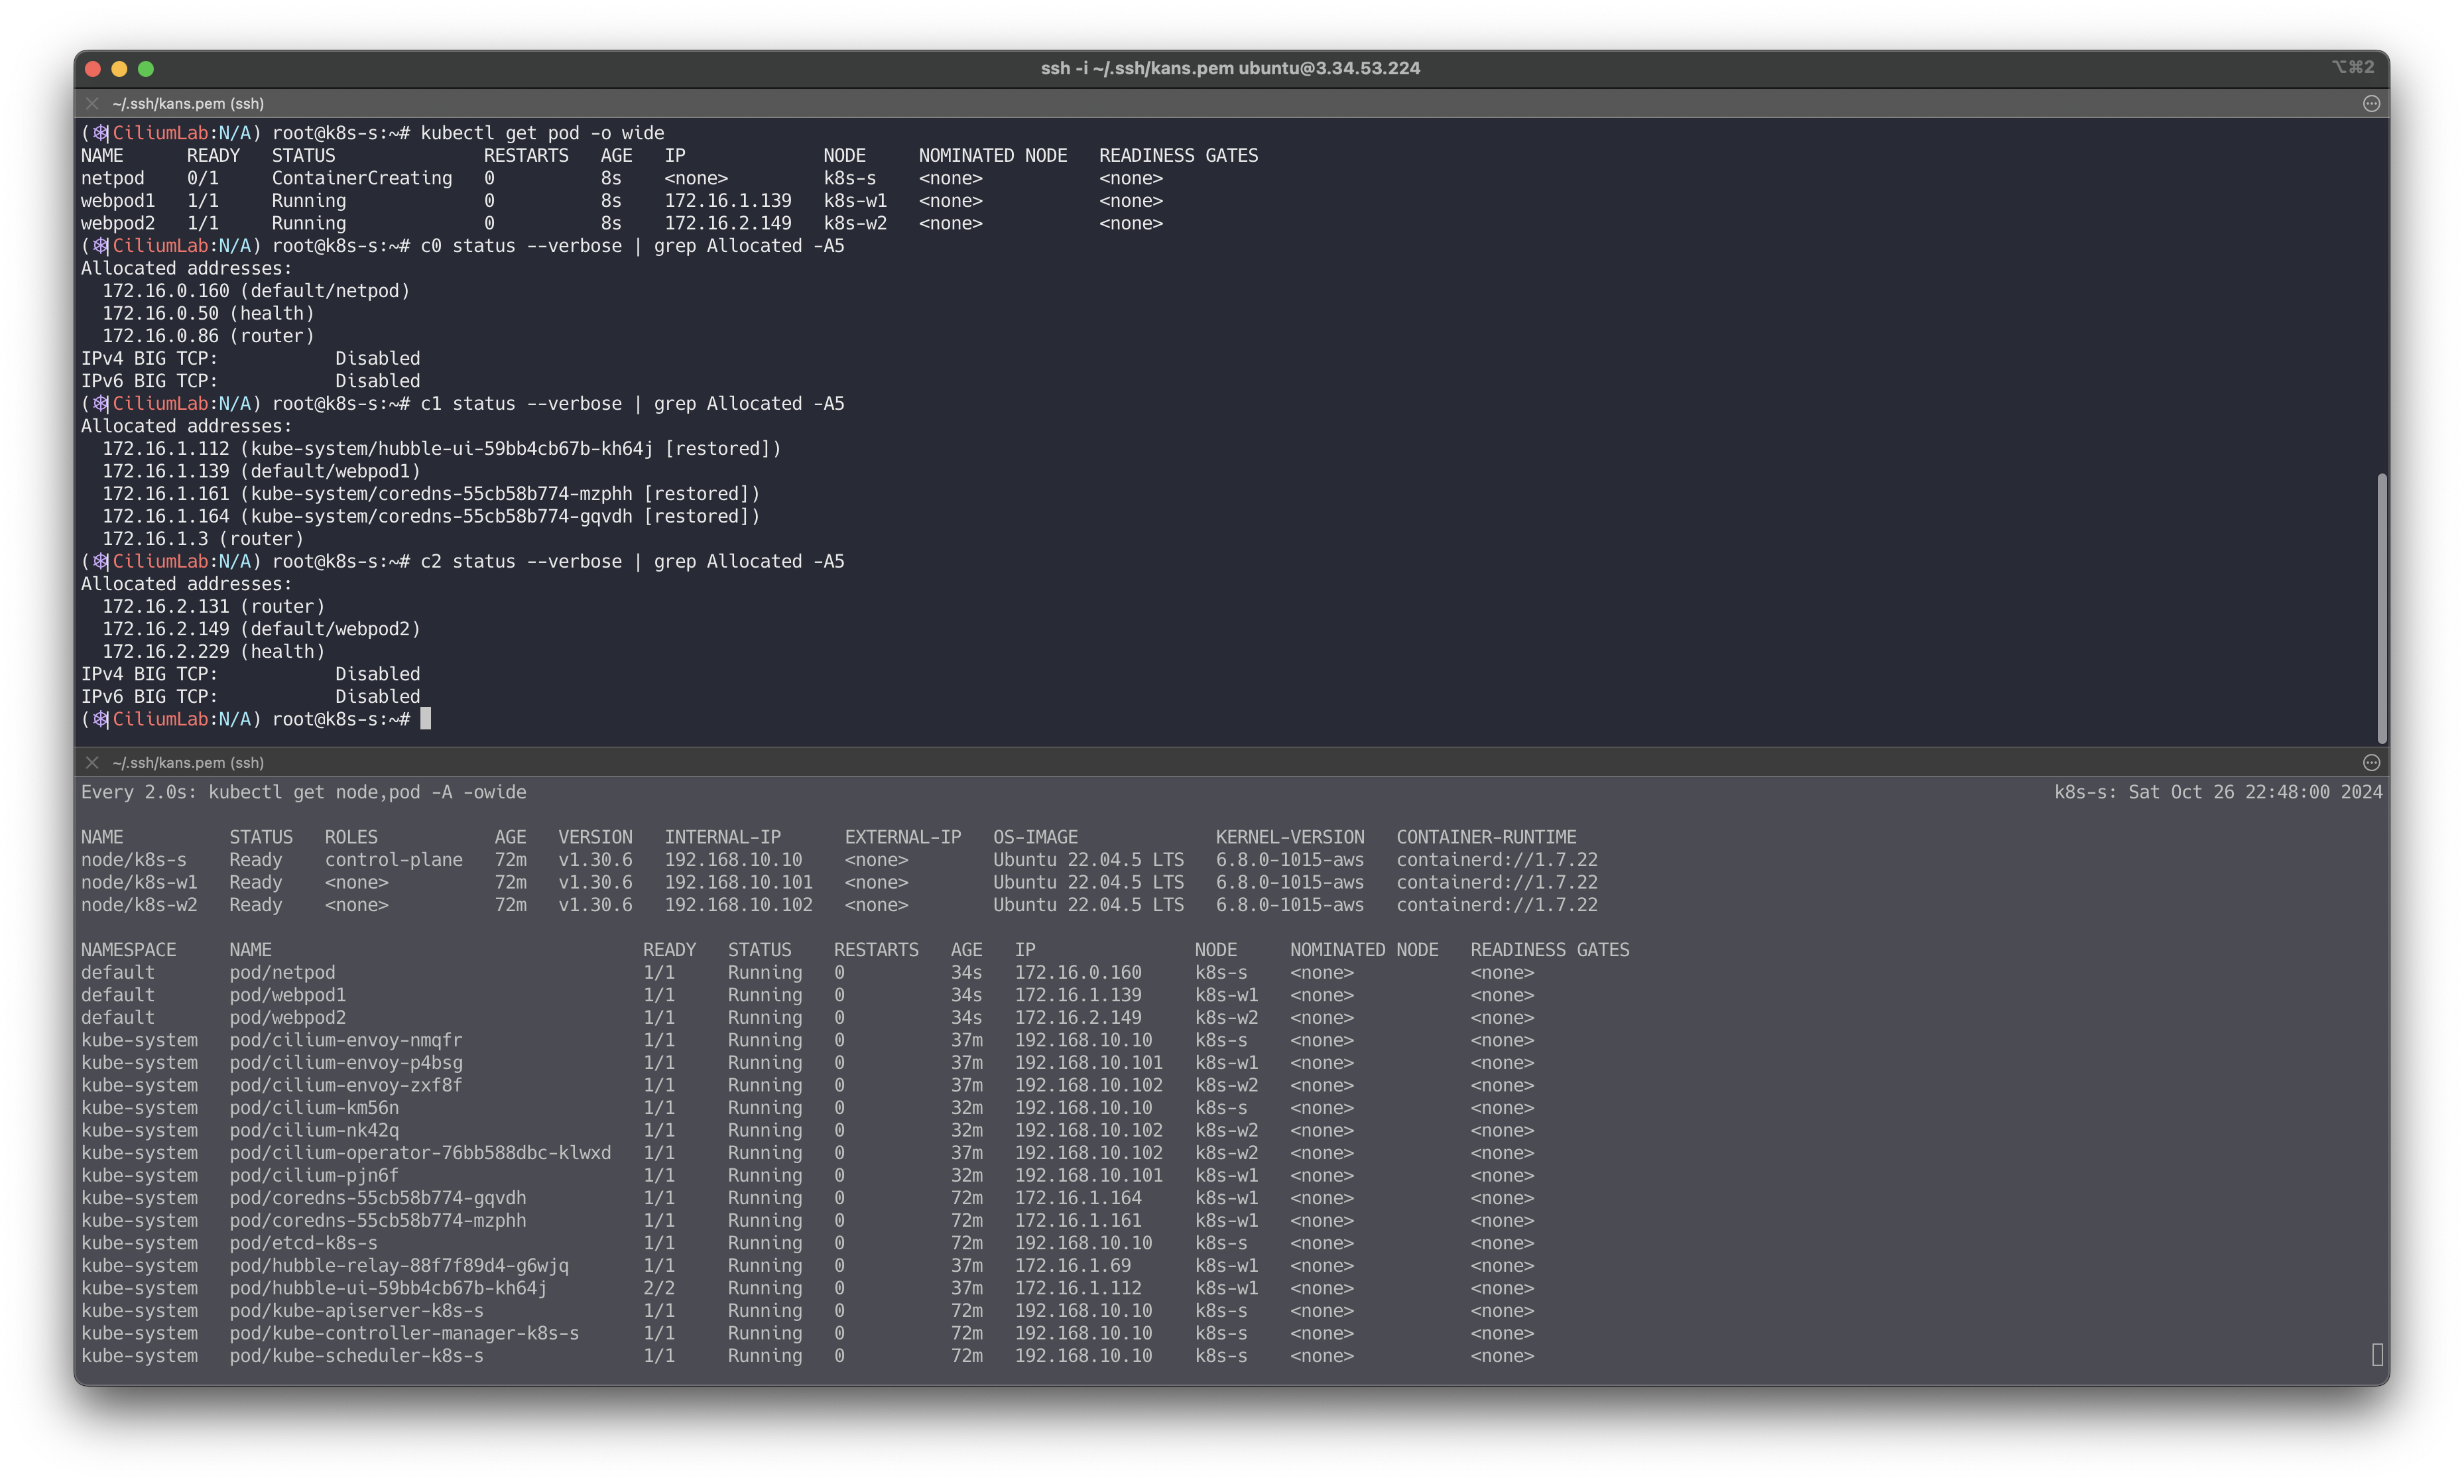
파드 생성 및 확인
cat <<EOF | kubectl create -f -
apiVersion: v1
kind: Pod
metadata:
  name: netpod
  labels:
    app: netpod
spec:
  nodeName: k8s-s
  containers:
  - name: netshoot-pod
    image: nicolaka/netshoot
    command: ["tail"]
    args: ["-f", "/dev/null"]
  terminationGracePeriodSeconds: 0
---
apiVersion: v1
kind: Pod
metadata:
  name: webpod1
  labels:
    app: webpod
spec:
  nodeName: k8s-w1
  containers:
  - name: container
    image: traefik/whoami
  terminationGracePeriodSeconds: 0
---
apiVersion: v1
kind: Pod
metadata:
  name: webpod2
  labels:
    app: webpod
spec:
  nodeName: k8s-w2
  containers:
  - name: container
    image: traefik/whoami
  terminationGracePeriodSeconds: 0
EOF
# 확인 kubectl get pod -o wide c0 status --verbose | grep Allocated -A5 c1 status --verbose | grep Allocated -A5 c2 status --verbose | grep Allocated -A5 kubectl get ciliumendpoints kubectl get ciliumendpoints -A c0 endpoint list c0 bpf endpoint list c0 map get cilium_lxc c0 ip list
파드 변수 지정
# 테스트 파드들 IP
NETPODIP=$(kubectl get pods netpod -o jsonpath='{.status.podIP}')
WEBPOD1IP=$(kubectl get pods webpod1 -o jsonpath='{.status.podIP}')
WEBPOD2IP=$(kubectl get pods webpod2 -o jsonpath='{.status.podIP}')

# 단축키(alias) 지정
alias p0="kubectl exec -it netpod  -- "
alias p1="kubectl exec -it webpod1 -- "
alias p2="kubectl exec -it webpod2 -- "
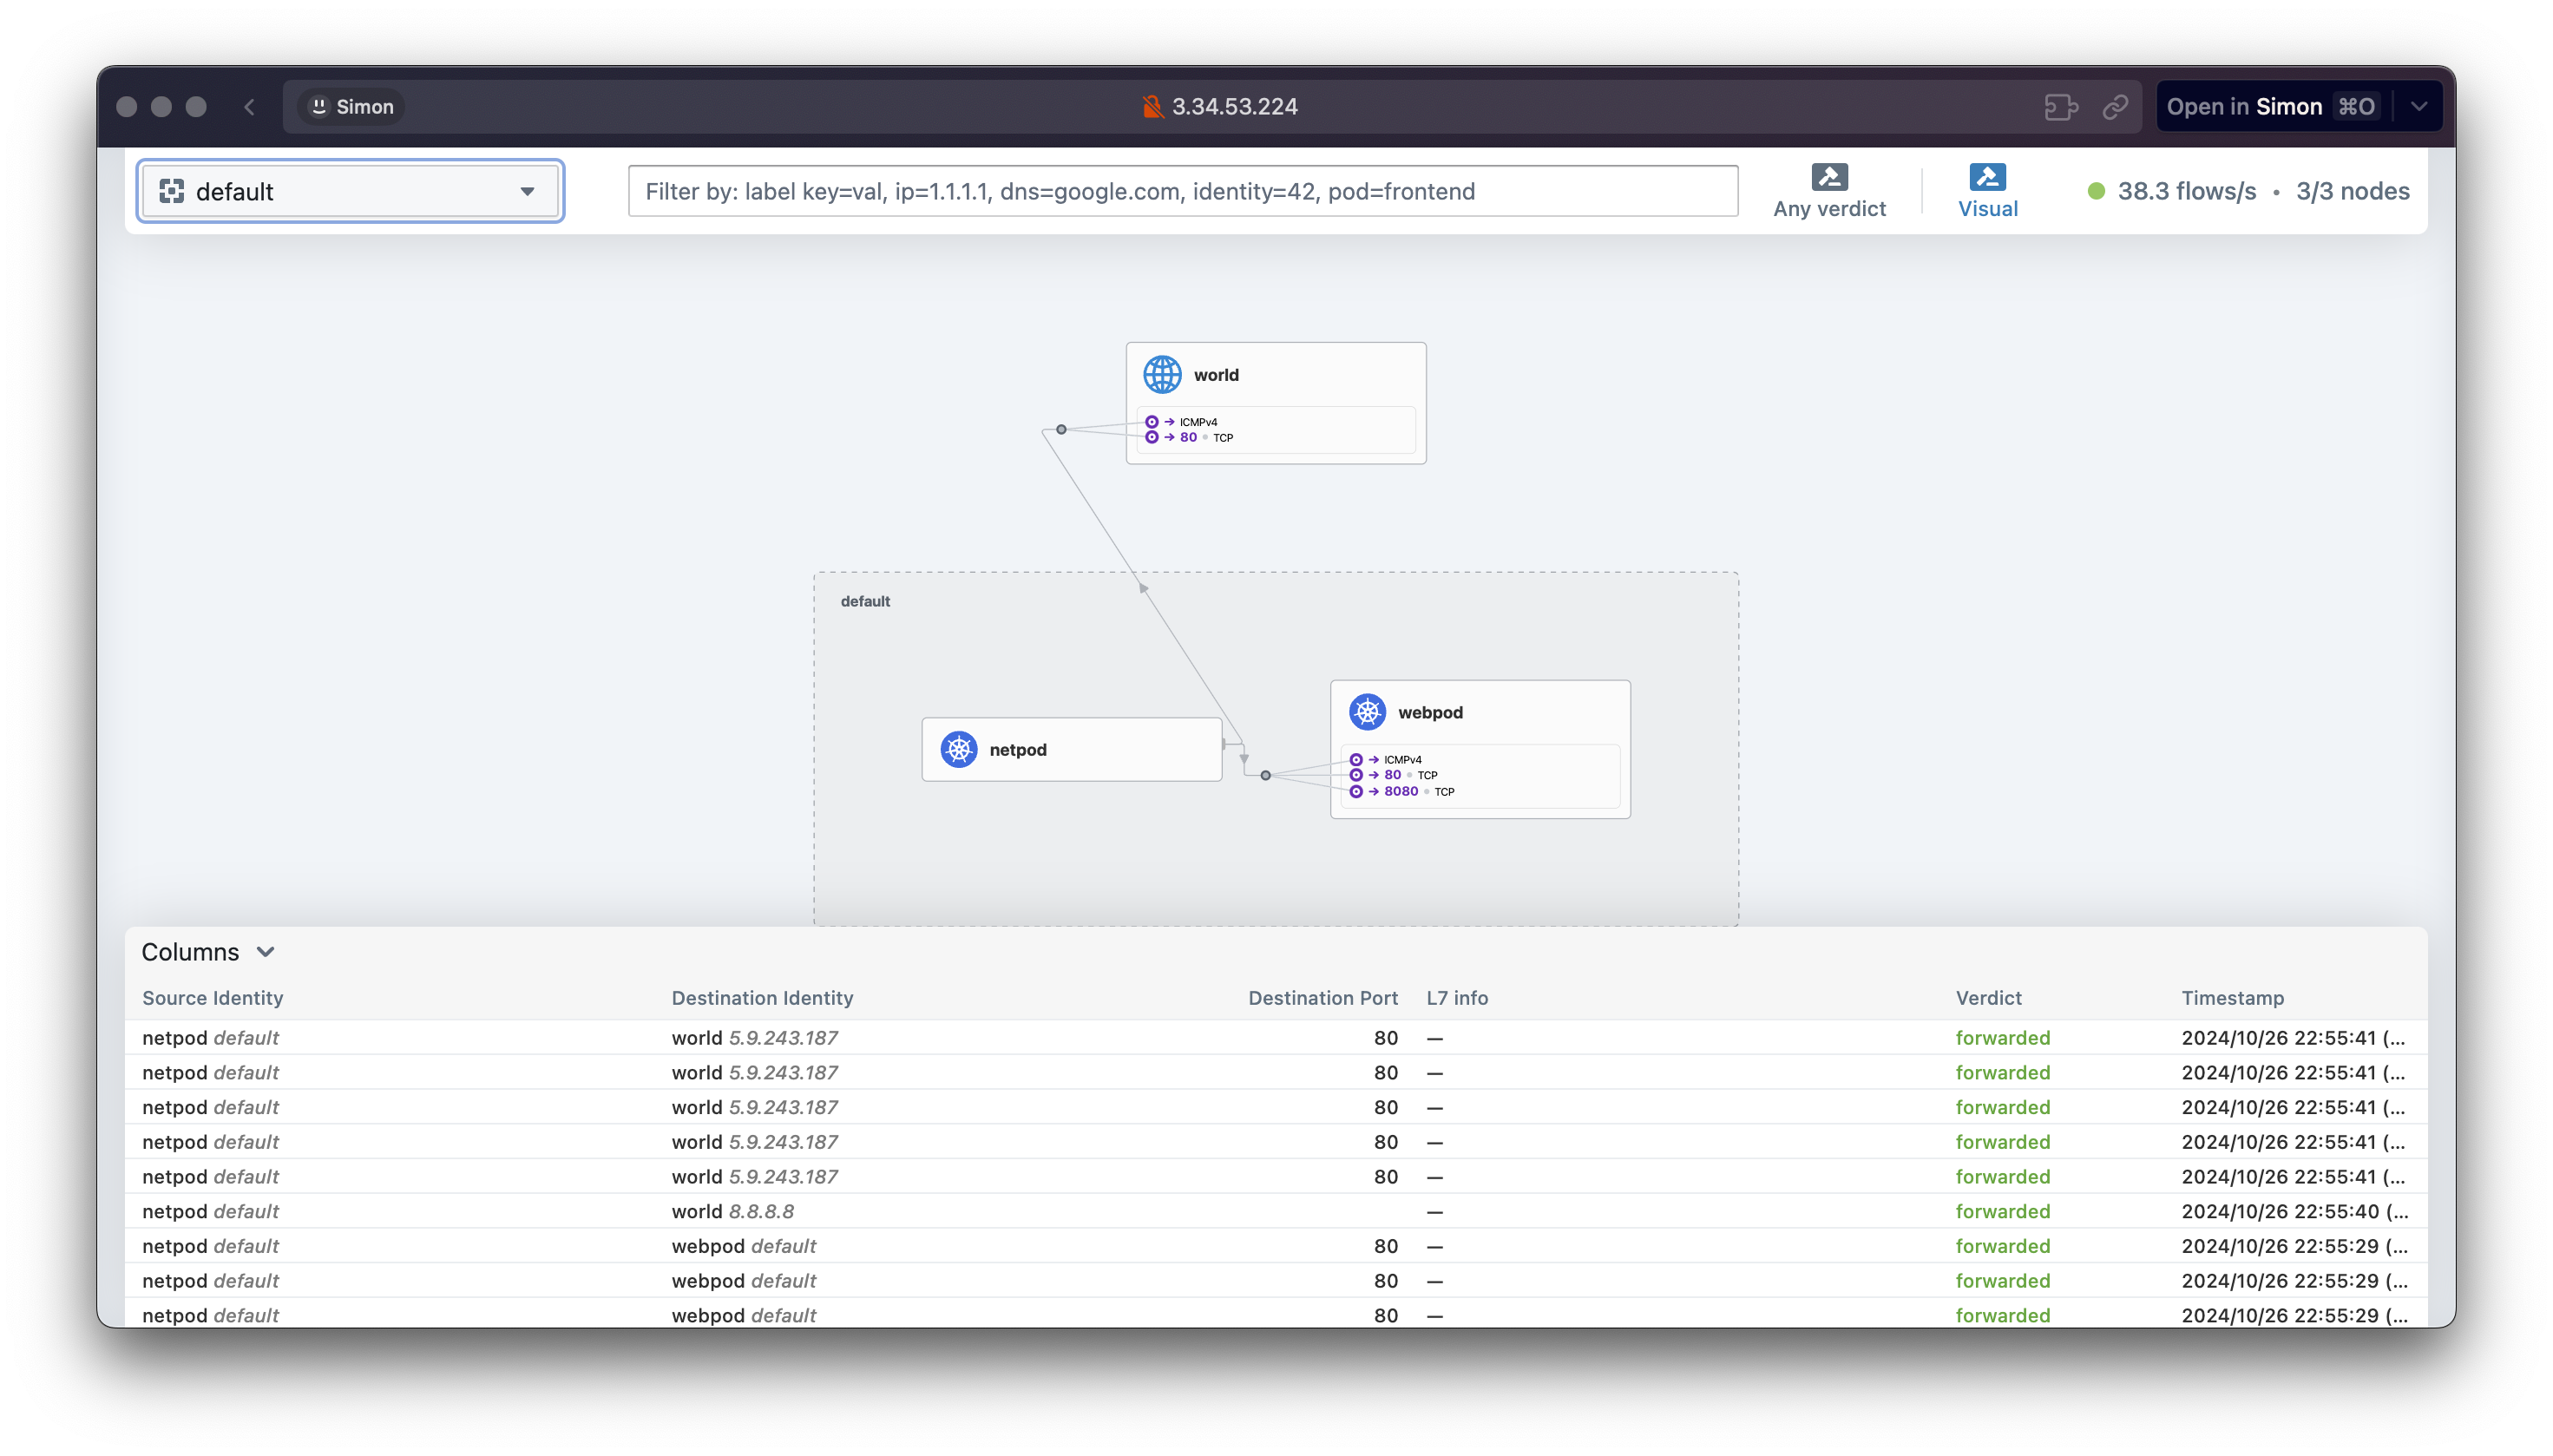
파드의 ARP 동작 확인 ← Hubble Web UI 모니터링
# netpod 네트워크 정보 확인
p0 ip -c -4 addr
p0 route -n
p0 ping -c 1 $WEBPOD1IP && p0 ping -c 1 $WEBPOD2IP
p0 curl -s $WEBPOD1IP && p0 curl -s $WEBPOD2IP
p0 curl -s $WEBPOD1IP:8080 ; p0 curl -s $WEBPOD2IP:8080
p0 ping -c 1 8.8.8.8 && p0 curl -s wttr.in/seoul
p0 ip -c neigh

# hubble cli 확인
hubble observe --pod netpod
hubble observe --pod webpod1
hubble observe --pod webpod2

# BPF maps : 목적지 파드와 통신 시 어느곳으로 보내야 될지 확인할 수 있다
c0 map get cilium_ipcache
c0 map get cilium_ipcache | grep $WEBPOD1IP

# netpod 의 LXC 변수 지정
LXC=<k8s-s의 가장 나중에 lxc 이름>
LXC=lxc335e04832afa

# 파드와 veth pair 에 IP가 없다! proxy_arp 도 없다! 하지만 GW MAC 요청 시 lxc(veth)의 MAC 으로 응답이 온다! >> eBPF Magic!
# Cilium hijacks ARP table of POD1, forces the next hop to be the peer end (host side) of the veth pair.
ip -c addr show dev $LXC
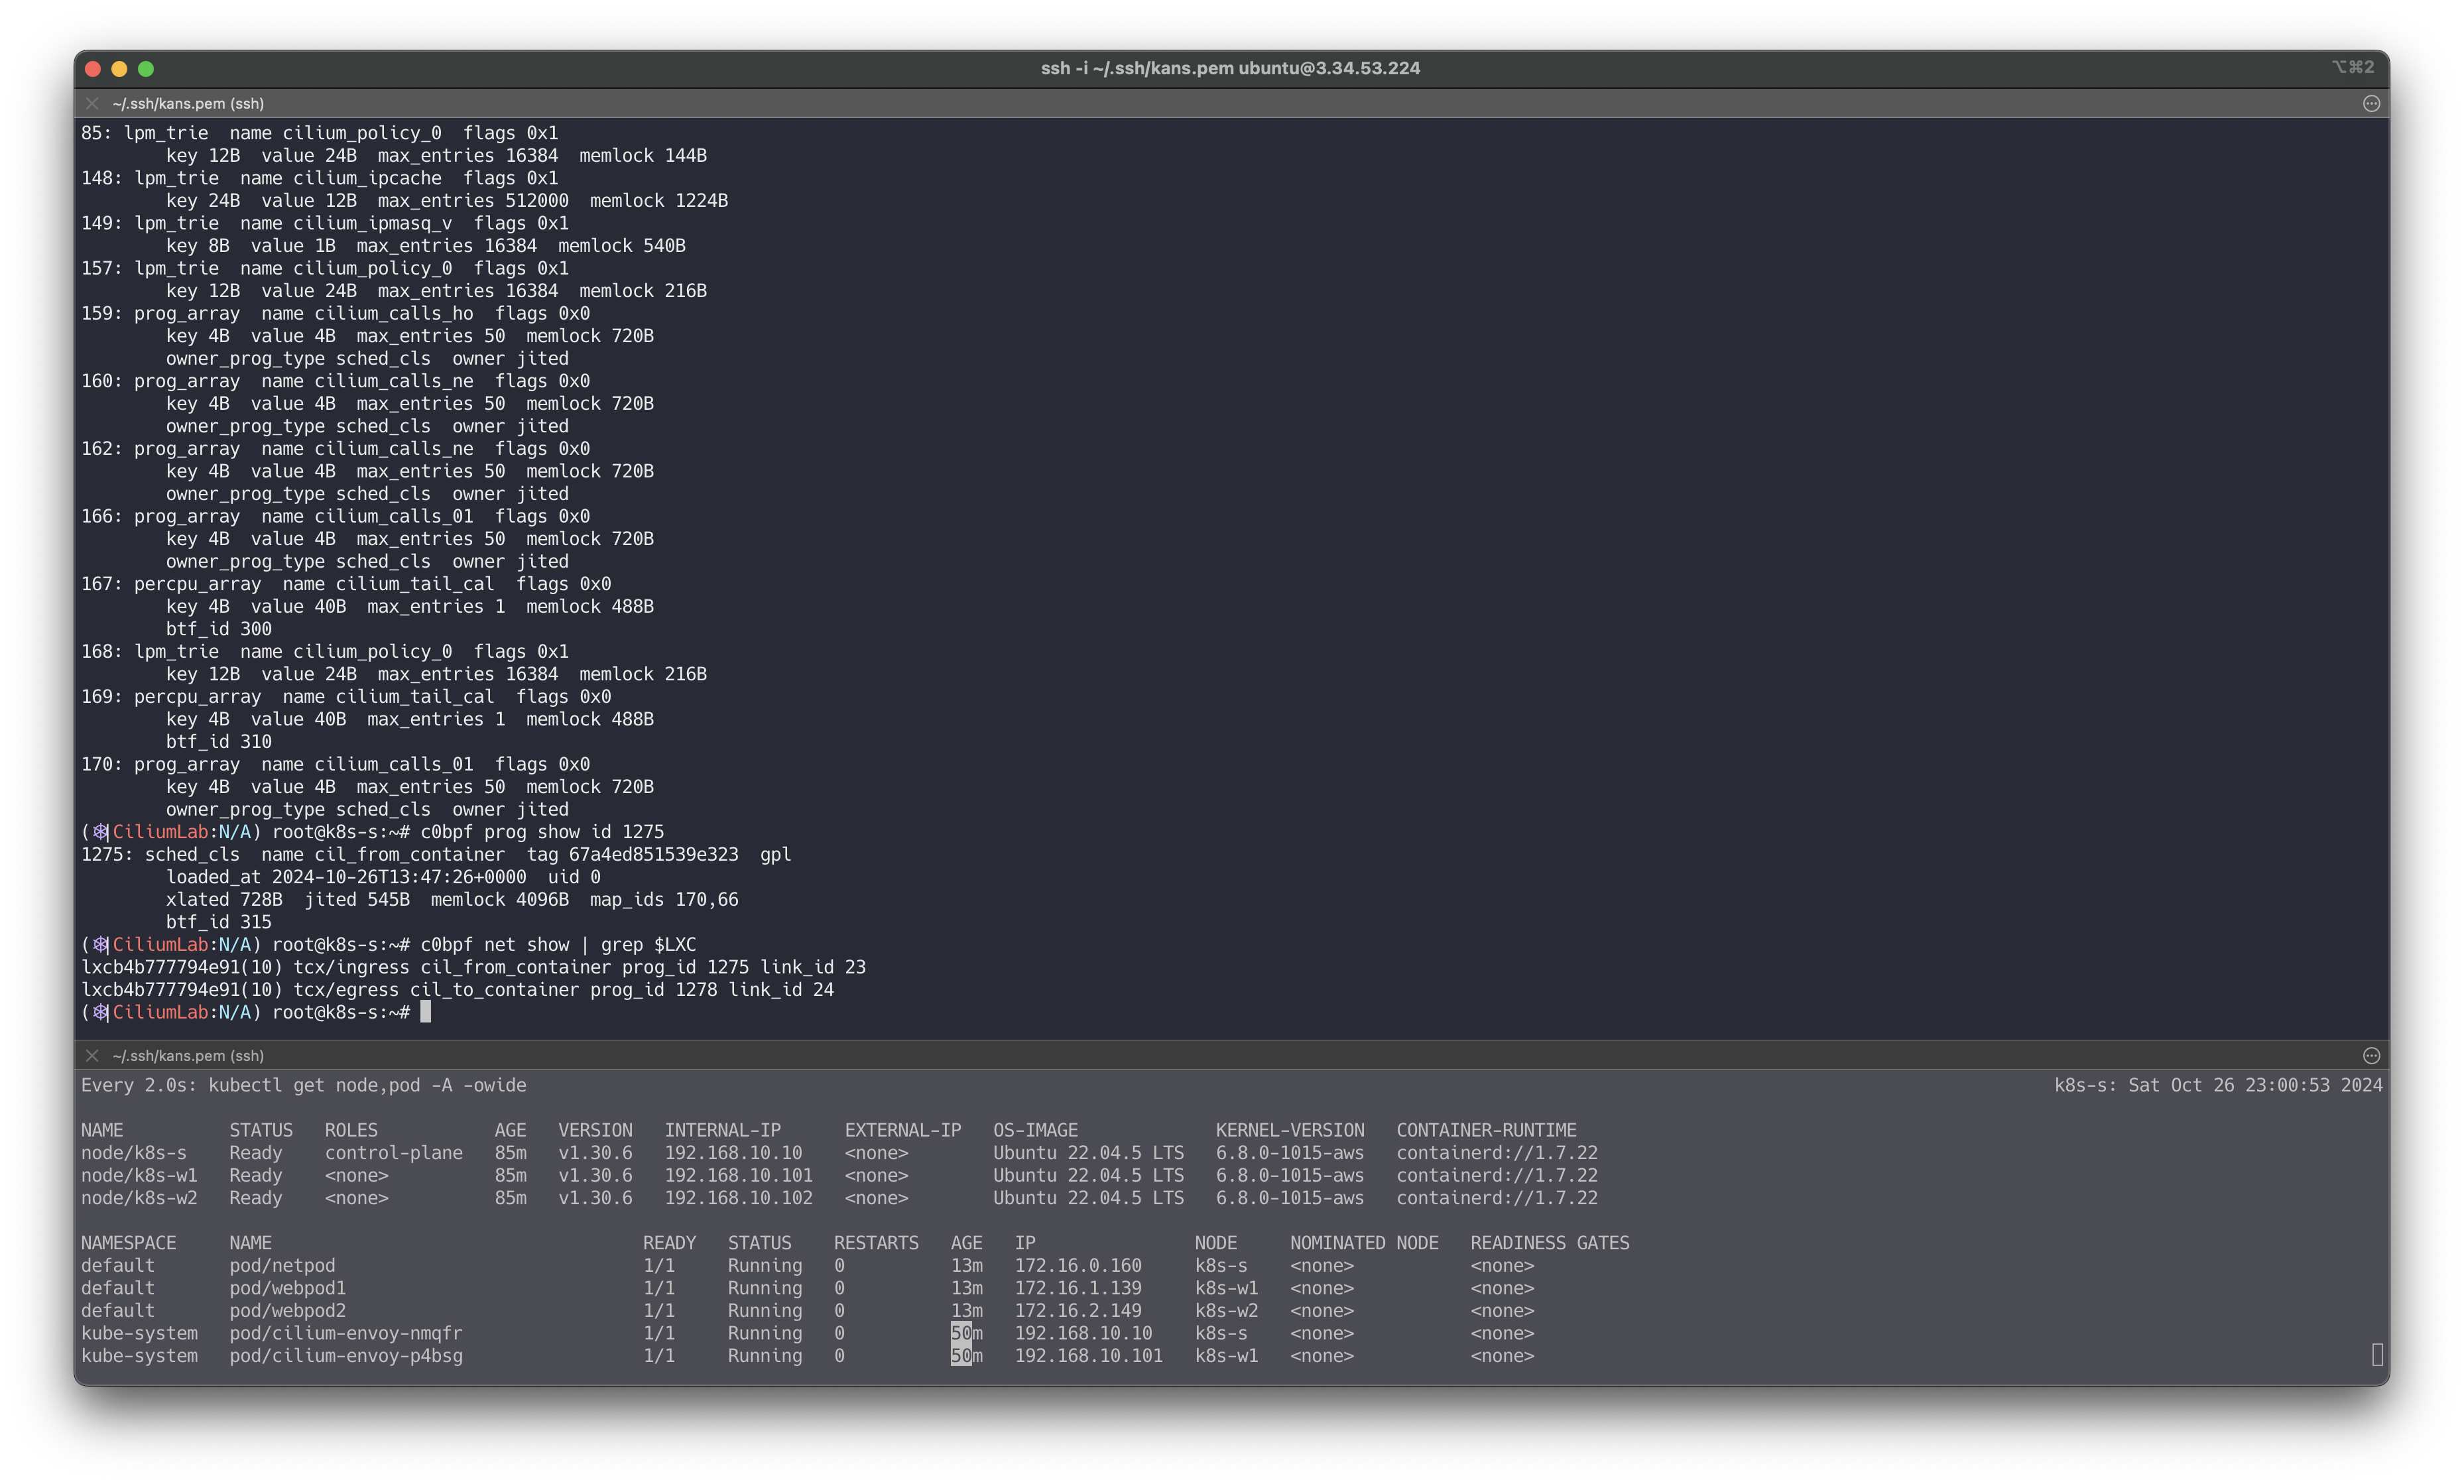
Node’s eBPF programs
# list of eBPF programs
c0bpf net show
c0bpf net show | grep $LXC
lxc335e04832afa(12) tcx/ingress cil_from_container prog_id 1529 link_id 26
lxc335e04832afa(12) tcx/egress cil_to_container prog_id 1531 link_id 27

# Use bpftool prog show id to view additional information about a program, including a list of attached eBPF maps:
c0bpf prog show id <출력된 prog id 입력>
c0bpf prog show id 1529
1531: sched_cls  name cil_to_container  tag 3f1e92871a2c4013  gpl
	loaded_at 2024-10-20T07:47:27+0000  uid 0
	xlated 1712B  jited 1015B  memlock 4096B  map_ids 66,239
	btf_id 474

c0bpf map list
...
66: percpu_hash  name cilium_metrics  flags 0x1
	key 8B  value 16B  max_entries 1024  memlock 19384B
...
239: prog_array  name cilium_calls_00  flags 0x0
	key 4B  value 4B  max_entries 50  memlock 720B
	owner_prog_type sched_cls  owner jited
...
👉 Step 03. 서비스 통신 확인
Socket-Based LoadBalancing 소개
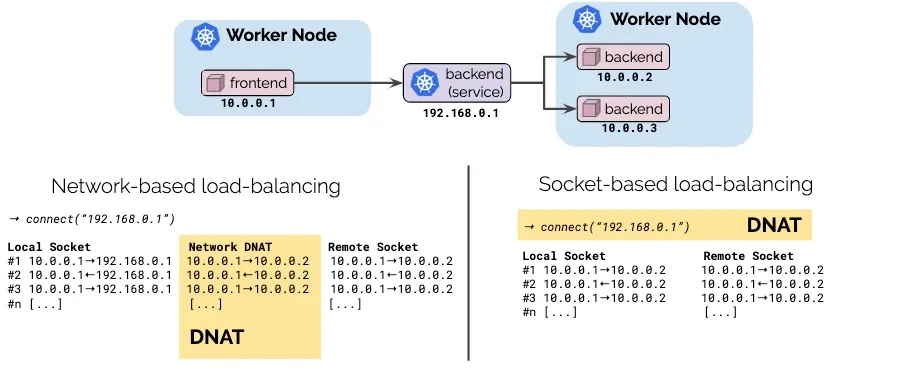
그림 왼쪽(네트워크 기반 로드밸런싱) vs 오른쪽(소켓 기반 로드밸런싱)
- Pod1 안에서 동작하는 앱이 connect() 시스템콜을 이용하여 소켓을 연결할 때 목적지 주소가 서비스 주소(10.10.8.55)이면 소켓의 목적지 주소를 바로 백엔드 주소(10.0.0.31)로 설정한다. 이후 앱에서 해당 소켓을 통해 보내는 모든 패킷의 목적지 주소는 이미 백엔드 주소(10.0.0.31)로 설정되어 있기 때문에 중간에 DNAT 변환 및 역변환 과정이 필요없어진다.
https://velog.io/@haruband/K8SCilium-Socket-Based-LoadBalancing-%EA%B8%B0%EB%B2%95
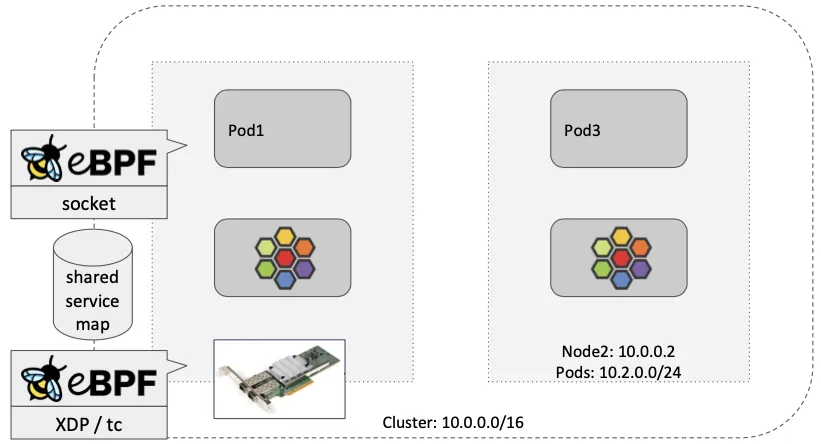
- Socket operations : BPF socket operations program 은 root cgroup 에 연결되며 TCP event(ESTABLISHED) 에서 실행한다.
- Socket send/recv : The socket send/recv hook 은 TCP socket 의 모든 송수신 작업에서 실행, hook 에서 검사/삭제/리다이렉션을 할 수 있다
https://cilium.io/blog/2020/11/10/ebpf-future-of-networking/
서비스 생성 및 접속 확인 : 파드 내에서 바로 DNAT! Magic!
서비스 생성
cat <<EOF | kubectl create -f -
apiVersion: v1
kind: Service
metadata:
  name: svc
spec:
  ports:
    - name: svc-webport
      port: 80
      targetPort: 80
  selector:
    app: webpod
  type: ClusterIP
EOF
서비스 접속 확인
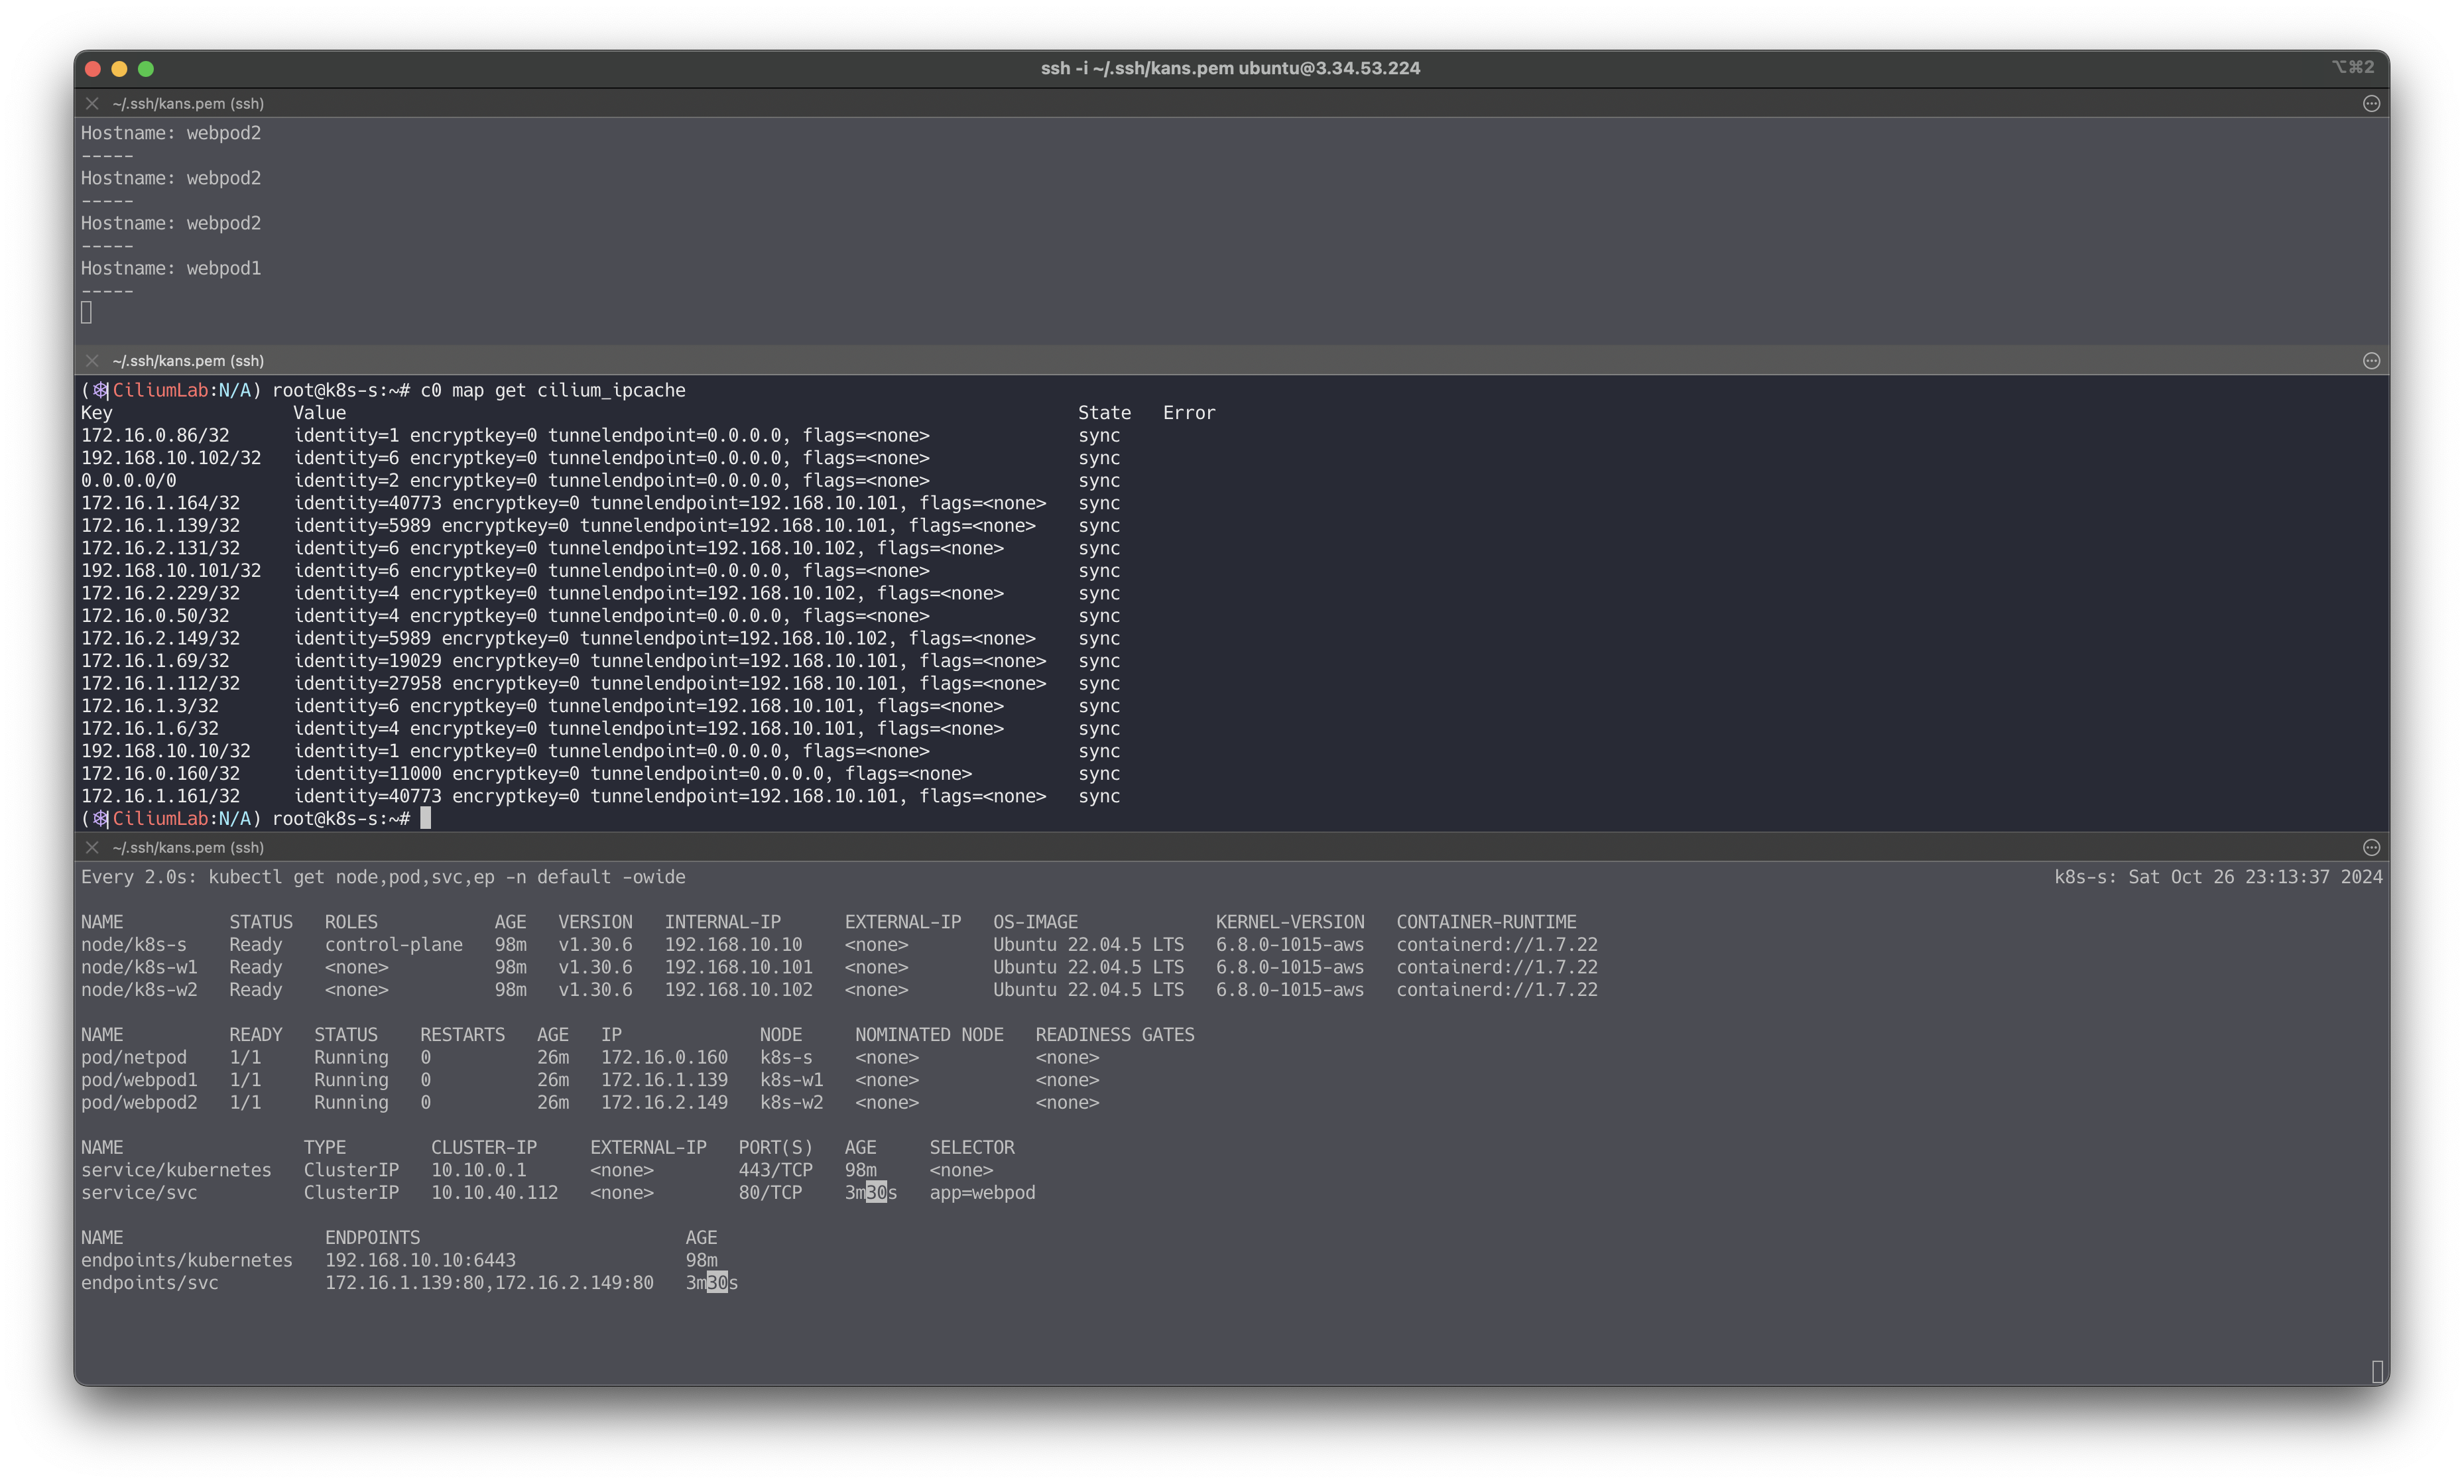
# 서비스 생성 확인
kubectl get svc,ep svc

# 노드에 iptables 더이상 KUBE-SVC rule 이 생성되지 않는다!
iptables-save | grep KUBE-SVC
iptables-save | grep CILIUM

# 서비스IP를 변수에 지정
SVCIP=$(kubectl get svc svc -o jsonpath='{.spec.clusterIP}')

# Pod1 에서 Service(ClusterIP) 접속 트래픽 발생
kubectl exec netpod -- curl -s $SVCIP
kubectl exec netpod -- curl -s $SVCIP | grep Hostname

# 지속적으로 접속 트래픽 발생
SVCIP=$(kubectl get svc svc -o jsonpath='{.spec.clusterIP}')
while true; do kubectl exec netpod -- curl -s $SVCIP | grep Hostname;echo "-----";sleep 1;done

# 파드에서 SVC(ClusterIP) 접속 시 tcpdump 로 확인 >> 파드 내부 캡쳐인데, SVC(10.108.12.195)는 보이지 않고, DNAT 된 web-pod 의 IP가 확인! Magic!
kubectl exec netpod -- tcpdump -enni any -q
	08:54:55.454271 eth0  Out ifindex 14 92:1a:b9:94:94:37 172.16.0.162.44718 > 172.16.1.234.80: tcp 0
	08:54:55.454798 eth0  In  ifindex 14 8a:0c:cc:a9:21:1a 172.16.1.234.80 > 172.16.0.162.44718: tcp 0
	08:54:55.455030 eth0  Out ifindex 14 92:1a:b9:94:94:37 172.16.0.162.44718 > 172.16.1.234.80: tcp 77
...

kubectl exec netpod -- sh -c "ngrep -tW byline -d eth0 '' 'tcp port 80'"
T 2024/10/20 08:07:36.663329 172.16.0.132:59964 -> 172.16.1.53:80 [AP] #34
GET / HTTP/1.1.
Host: 10.10.124.15.
User-Agent: curl/8.7.1.
Accept: */*.


# 서비스 정보 확인
c0 service list
ID   Frontend              Service Type   Backend
16   10.108.12.195:80      ClusterIP      1 => 172.16.2.157:80
                                          2 => 172.16.1.234:80
c0 bpf lb list
SERVICE ADDRESS       BACKEND ADDRESS
10.108.12.195:80      0.0.0.0:0 (16) [ClusterIP, non-routable]
                      172.16.1.234:80 (16)
                      172.16.2.157:80 (16)
# BPF maps
c0 map list --verbose
c0 map list --verbose | grep lb
c0 map get cilium_lb4_services_v2
c0 map get cilium_lb4_backends_v3
c0 map get cilium_lb4_reverse_nat
c0 map get cilium_lb4_reverse_sk
c0 map get cilium_lxc
c0 map get cilium_ipcache
Socket-Based LoadBalancing 관련 설정값 확인 및 Cgroup 관련 정보 확인
# Socket-Based LoadBalancing 관련 설정들 확인
c0 status --verbose
...
KubeProxyReplacement Details:
  Status:                 True
  Socket LB:              Enabled
  Socket LB Tracing:      Enabled
  Socket LB Coverage:     Full
  Devices:                ens5   192.168.10.10 fe80::57:abff:fee3:da8d (Direct Routing)
  Mode:                   SNAT
  Backend Selection:      Random
  Session Affinity:       Enabled
  Graceful Termination:   Enabled
  NAT46/64 Support:       Disabled
  XDP Acceleration:       Disabled
  Services:
  - ClusterIP:      Enabled
  - NodePort:       Enabled (Range: 30000-32767)
  - LoadBalancer:   Enabled
  - externalIPs:    Enabled
  - HostPort:       Enabled

# cgroup root 경로 확인
tree /run/cilium/cgroupv2 -L 1
tree /run/cilium/cgroupv2 -L 2
cilium config view | grep cgroup
cgroup-root                                    /run/cilium/cgroupv2

# eBPF cgroup 확인 : Socket based LB 와 관련
c0bpf cgroup tree
CgroupPath
ID       AttachType      AttachFlags     Name
/sys/fs/cgroup
1081     cgroup_device   multi
1498     tcx_ingress                     cil_to_host
1501     tcx_egress                      cil_from_host

# cilium 파드의 Init Containers 에서 cgroup 마운트!
Init Containers:
  mount-cgroup:
    Container ID:  containerd://72e9d2ee9731e3536c893f9daaa7674809638e3d137f9eb0f46fe916c2aa2839
    Image:         quay.io/cilium/cilium:v1.16.3@sha256:62d2a09bbef840a46099ac4c69421c90f84f28d018d479749049011329aa7f28
    Image ID:      quay.io/cilium/cilium@sha256:62d2a09bbef840a46099ac4c69421c90f84f28d018d479749049011329aa7f28
    Port:          <none>
    Host Port:     <none>
    Command:
      sh
      -ec
      cp /usr/bin/cilium-mount /hostbin/cilium-mount;
      nsenter --cgroup=/hostproc/1/ns/cgroup --mount=/hostproc/1/ns/mnt "${BIN_PATH}/cilium-mount" $CGROUP_ROOT;
      rm /hostbin/cilium-mount

    State:          Terminated
      Reason:       Completed
      Exit Code:    0
      Started:      Sun, 20 Oct 2024 15:45:34 +0900
      Finished:     Sun, 20 Oct 2024 15:45:34 +0900
    Ready:          True
    Restart Count:  0
    Environment:
      CGROUP_ROOT:  /run/cilium/cgroupv2
      BIN_PATH:     /opt/cni/bin
    Mounts:
      /hostbin from cni-path (rw)
      /hostproc from hostproc (rw)
      /var/run/secrets/kubernetes.io/serviceaccount from kube-api-access-p6bcr (ro)

# mount-cgroup 로그 확인
kubetail -n kube-system -c mount-cgroup --since 12h
...
[cilium-lnwcr] time="2024-10-20T15:45:52+09:00" level=info msg="Mounted cgroupv2 filesystem at /run/cilium/cgroupv2" subsys=cgroups
[cilium-jmr7d] time="2024-10-20T15:45:33+09:00" level=info msg="Mounted cgroupv2 filesystem at /run/cilium/cgroupv2" subsys=cgroups
...
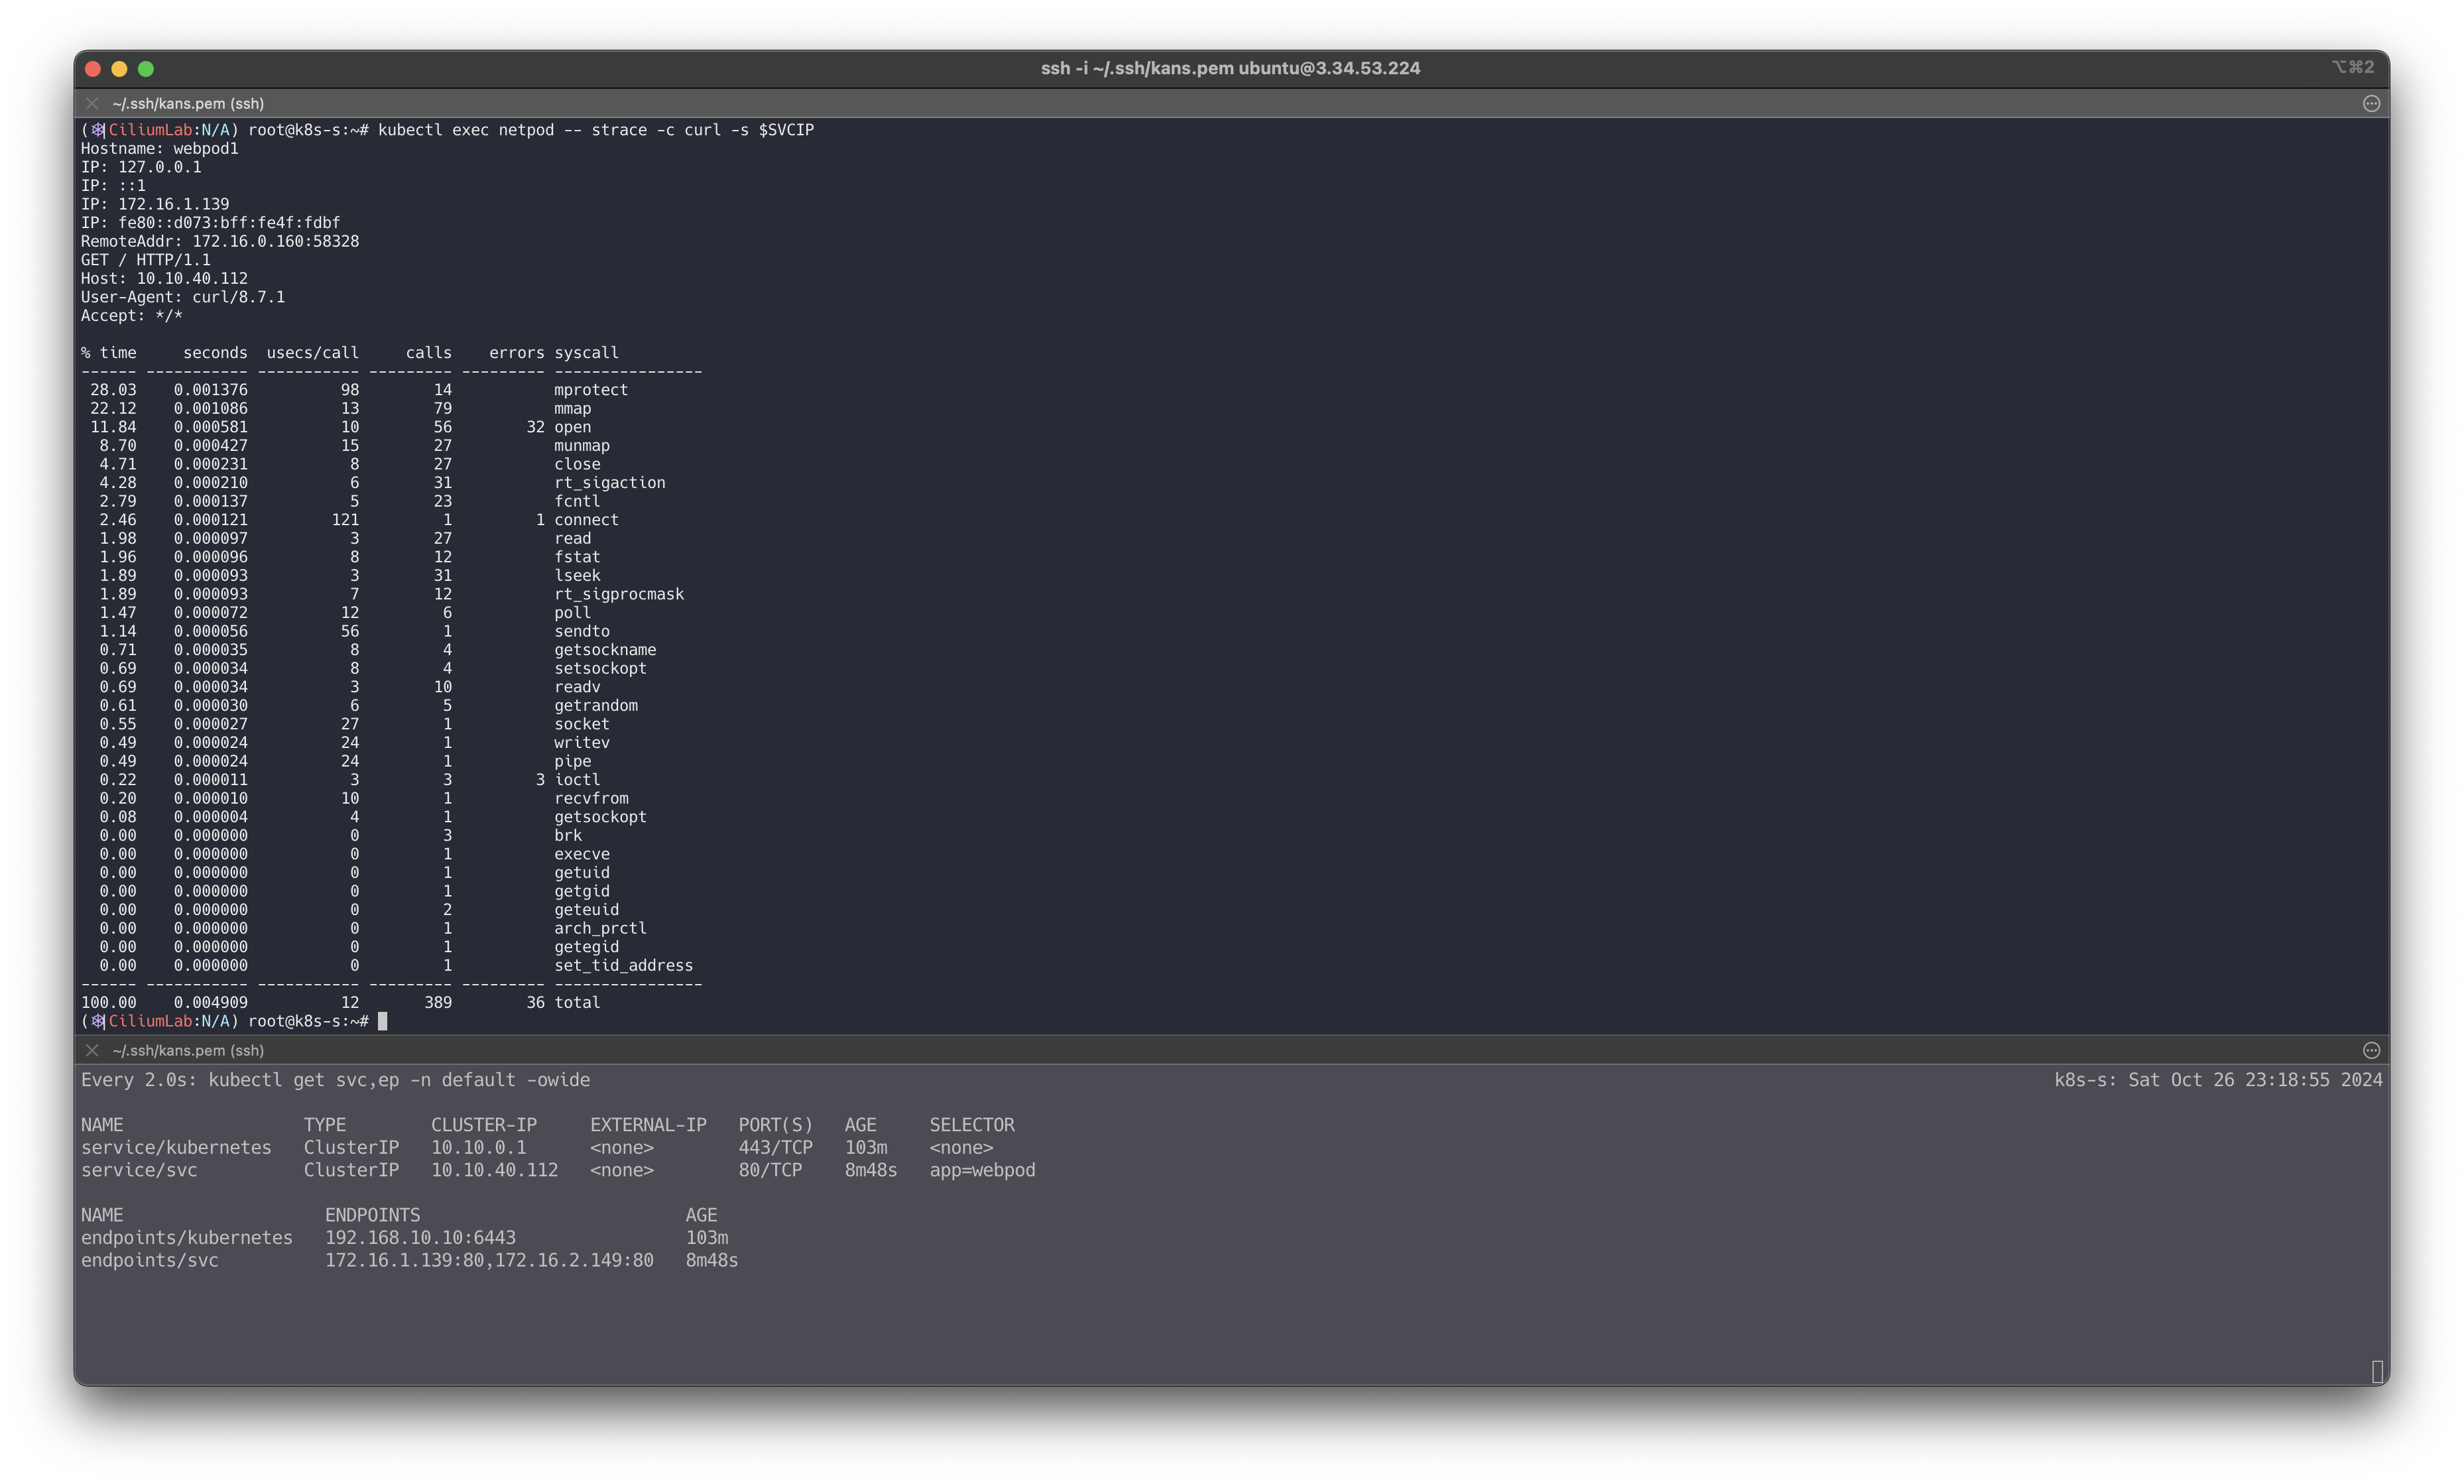
strace 시스템 콜 트레이싱 도구를 통해 파드 내에서 동작 확인*
# syacall 호출 확인
kubectl exec netpod -- strace -c curl -s $SVCIP
% time     seconds  usecs/call     calls    errors syscall
------ ----------- ----------- --------- --------- ----------------
 28.74    0.000971          12        79           mmap
 16.37    0.000553           9        56        32 open
 10.33    0.000349          29        12           fstat
  5.83    0.000197           6        31           rt_sigaction
  5.62    0.000190           7        27           munmap
  5.33    0.000180           6        27           close
  3.17    0.000107           3        27           read
  2.81    0.000095          15         6           poll
  2.69    0.000091           3        23           fcntl
  2.66    0.000090           2        31           lseek
  2.63    0.000089           8        10           readv
  2.34    0.000079           5        14           mprotect
  2.31    0.000078          78         1         1 connect
  2.25    0.000076           6        12           rt_sigprocmask
  1.30    0.000044          44         1           sendto
  1.12    0.000038           9         4           getsockname
  0.89    0.000030           7         4           setsockopt
  0.50    0.000017           3         5           getrandom
  0.50    0.000017          17         1           socket
  0.44    0.000015           5         3           brk
  0.44    0.000015          15         1           writev
  0.41    0.000014           4         3         3 ioctl
  0.38    0.000013          13         1           getsockopt
  0.27    0.000009           9         1           recvfrom
  0.27    0.000009           9         1           arch_prctl
  0.21    0.000007           7         1           pipe
  0.18    0.000006           6         1           set_tid_address
  0.00    0.000000           0         1           execve
  0.00    0.000000           0         1           getuid
  0.00    0.000000           0         1           getgid
  0.00    0.000000           0         2           geteuid
  0.00    0.000000           0         1           getegid
------ ----------- ----------- --------- --------- ----------------
100.00    0.003379           8       389        36 total


# 출력 내용을 편집기에서 확인(검색)
kubectl exec netpod -- strace -s 65535 -f -tt curl -s $SVCIP
------------------------------------------------------------
08:19:14.846995 connect(5, {sa_family=AF_INET, sin_port=htons(80), sin_addr=inet_addr("10.10.124.15")}, 16) = -1 EINPROGRESS (Operation in progress) # 소켓 연결 시도
08:19:14.847653 getsockname(5, {sa_family=AF_INET, sin_port=htons(41312), sin_addr=inet_addr("172.16.0.132")}, [128 => 16]) = 0 # 소켓 주소 가져오기
...
08:19:14.852497 getsockopt(5, SOL_SOCKET, SO_ERROR, [0], [4]) = 0 # 소켓 연결 성공
08:19:14.852940 getsockname(5, {sa_family=AF_INET, sin_port=htons(41312), sin_addr=inet_addr("172.16.0.132")}, [128 => 16]) = 0 # 소켓 주소 한번더 확인
...

# 특정 이벤트 : -e
kubectl exec netpod -- strace -e trace=connect curl -s $SVCIP
kubectl exec netpod -- strace -e trace=getsockname curl -s $SVCIP
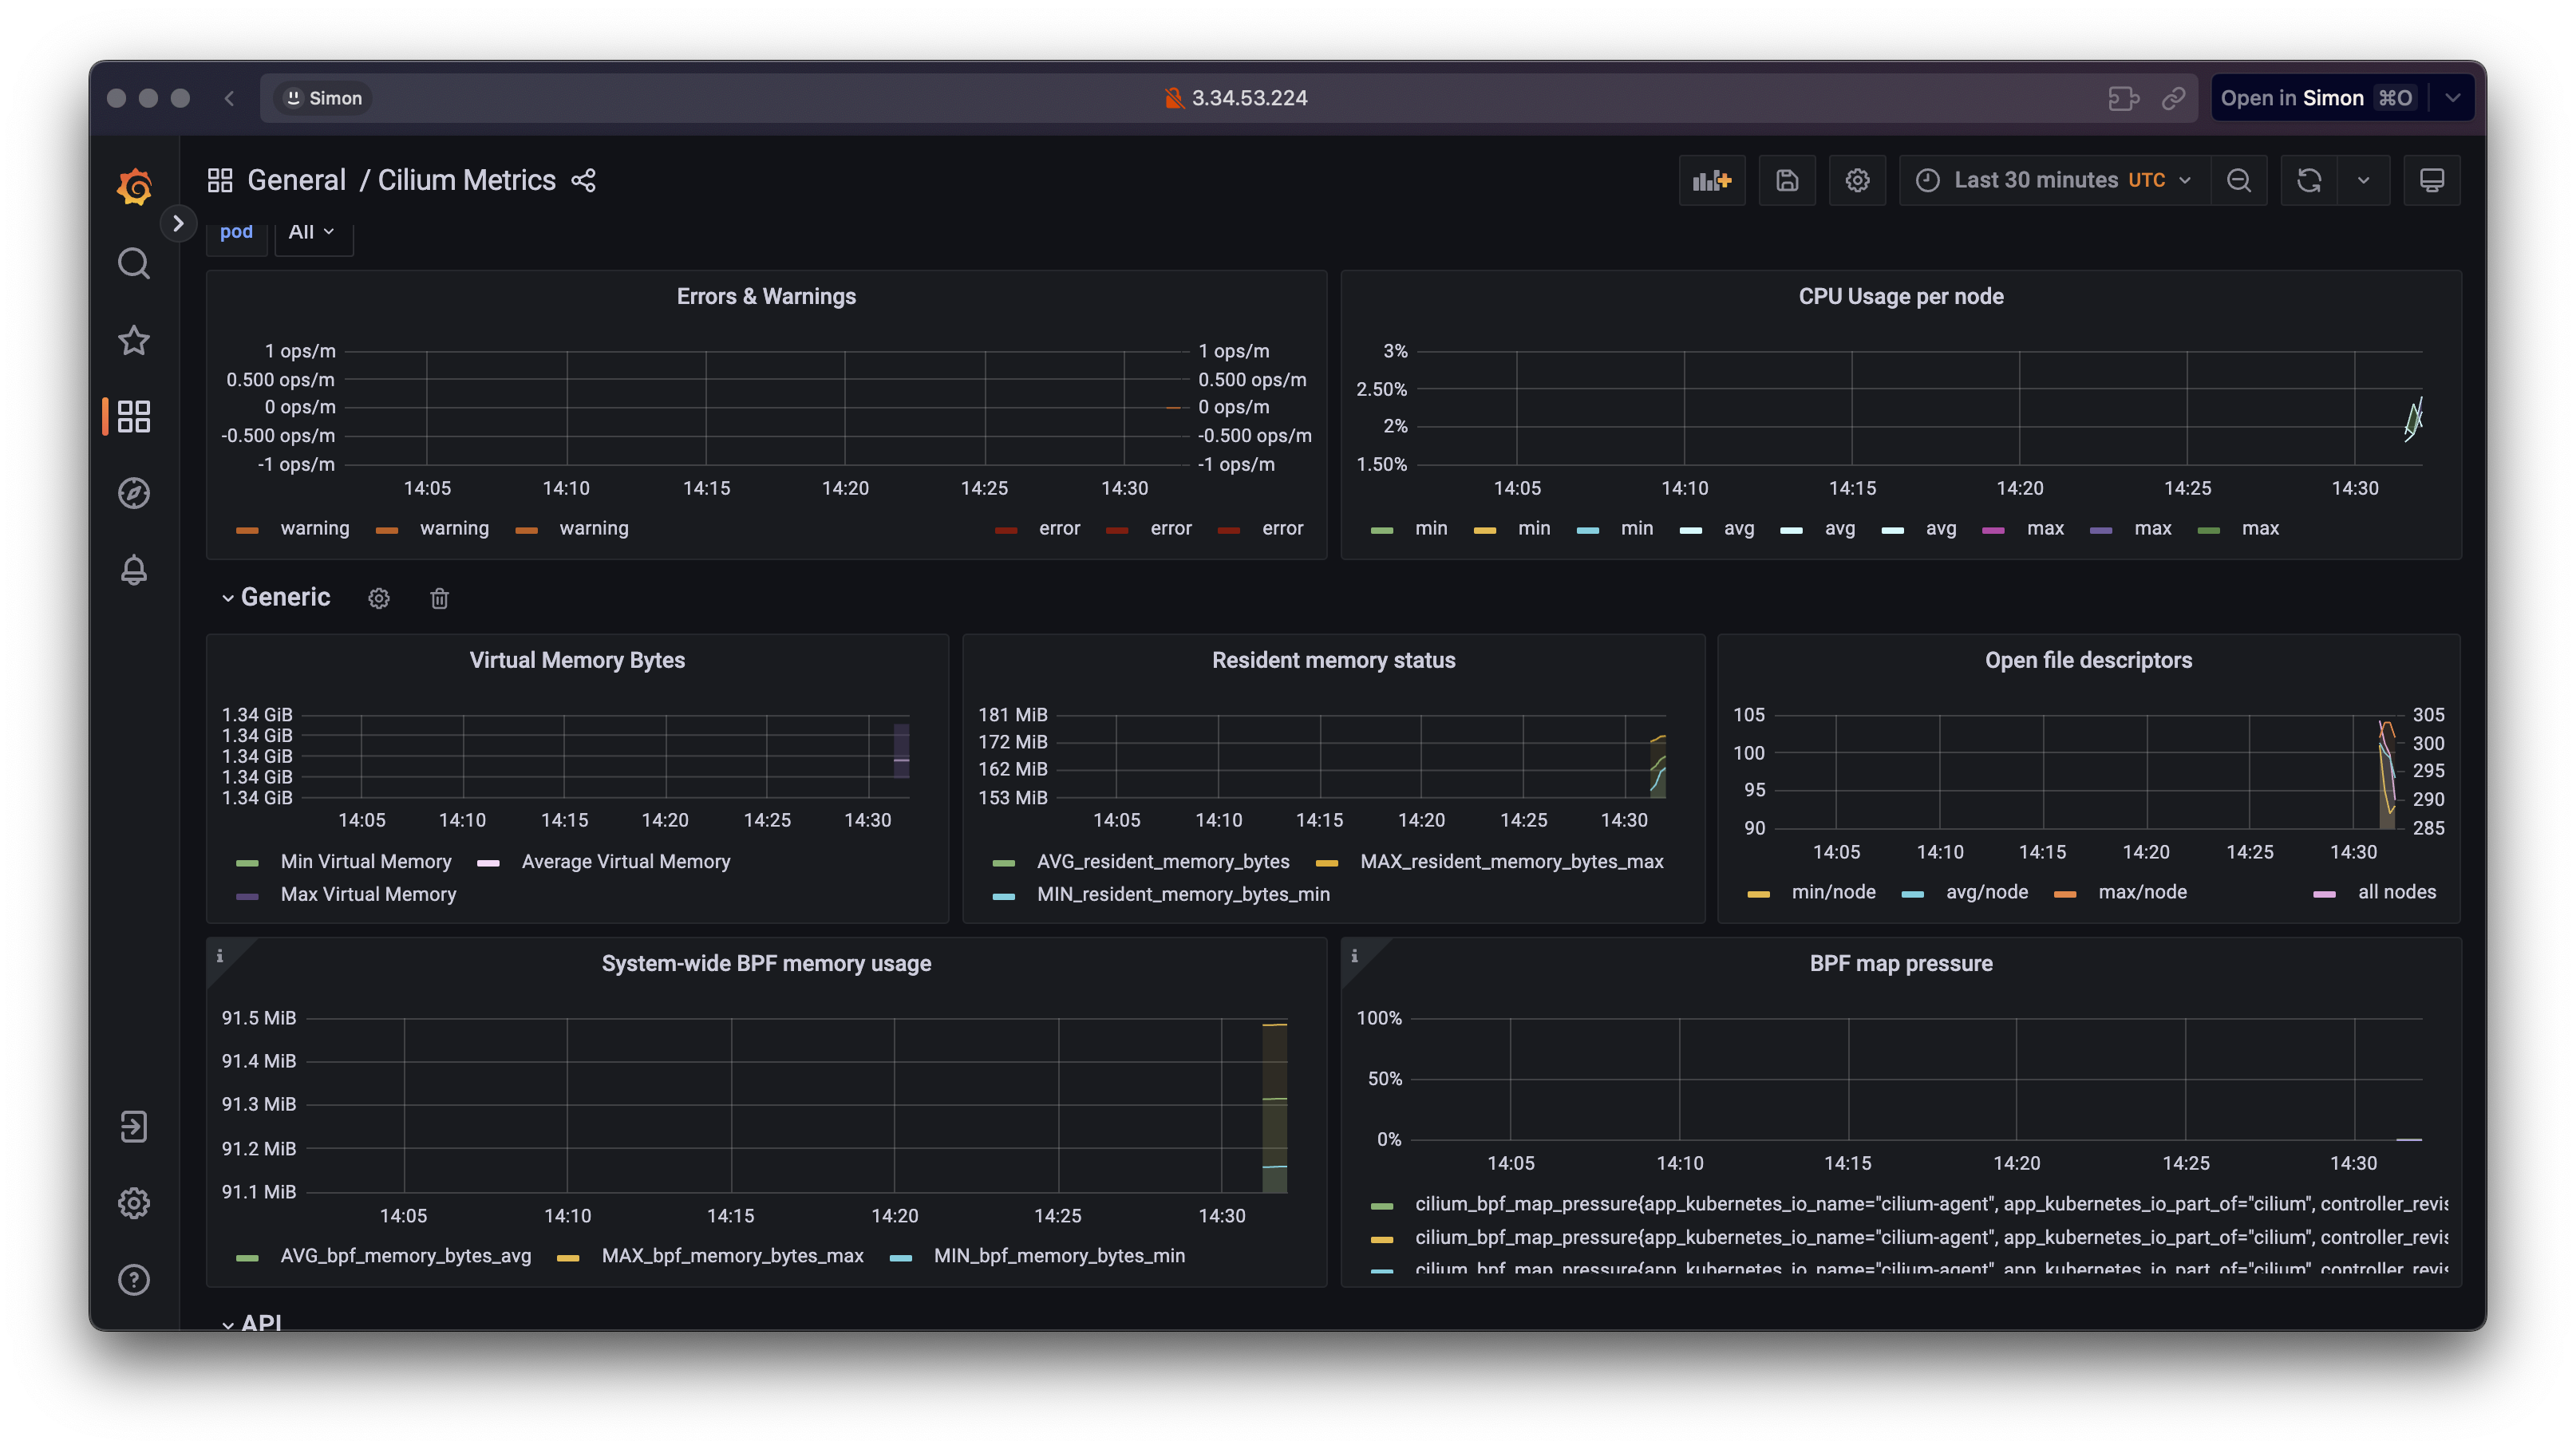
👉 Step 04. Running Prometheus & Grafana
설정
# 배포
kubectl apply -f https://raw.githubusercontent.com/cilium/cilium/1.16.3/examples/kubernetes/addons/prometheus/monitoring-example.yaml
kubectl get all -n cilium-monitoring

# 파드와 서비스 확인
kubectl get pod,svc,ep -o wide -n cilium-monitoring

# NodePort 설정
kubectl patch svc grafana -n cilium-monitoring -p '{"spec": {"type": "NodePort"}}'
kubectl patch svc prometheus -n cilium-monitoring -p '{"spec": {"type": "NodePort"}}'

# Grafana 웹 접속
GPT=$(kubectl get svc -n cilium-monitoring grafana -o jsonpath={.spec.ports[0].nodePort})
echo -e "Grafana URL = http://$(curl -s ipinfo.io/ip):$GPT"

# Prometheus 웹 접속 정보 확인
PPT=$(kubectl get svc -n cilium-monitoring prometheus -o jsonpath={.spec.ports[0].nodePort})
echo -e "Prometheus URL = http://$(curl -s ipinfo.io/ip):$PPT"
👉 Step 05. Network Policy (L3, L4, L7)
Security
- Securing Networks with Cilium - Link
- Identity-Aware and HTTP-Aware Policy Enforcement - Link
- Locking Down External Access with DNS-Based Policies - Link
- Inspecting TLS Encrypted Connections with Cilium - Link
- Securing a Kafka Cluster - Link
- Securing gRPC - Link
- Securing Elasticsearch - Link
- Securing a Cassandra Database - Link
- Securing Memcached - Link
- Locking Down External Access Using AWS Metadata - Link
- Creating Policies from Verdicts - Link
- Host Firewall - Link
- Restricting privileged Cilium pod access - Link
- Overview of Network Security - Link
- Overview of Network Policy - Link
- Threat Model - Link
Cilium Security Intro : Cilium provides security on multiple levels - Docs
- ID 기반 Identity-Based: Connectivity policies between endpoints (Layer 3), e.g. any endpoint with label
role=frontendcan connect to any endpoint with labelrole=backend.
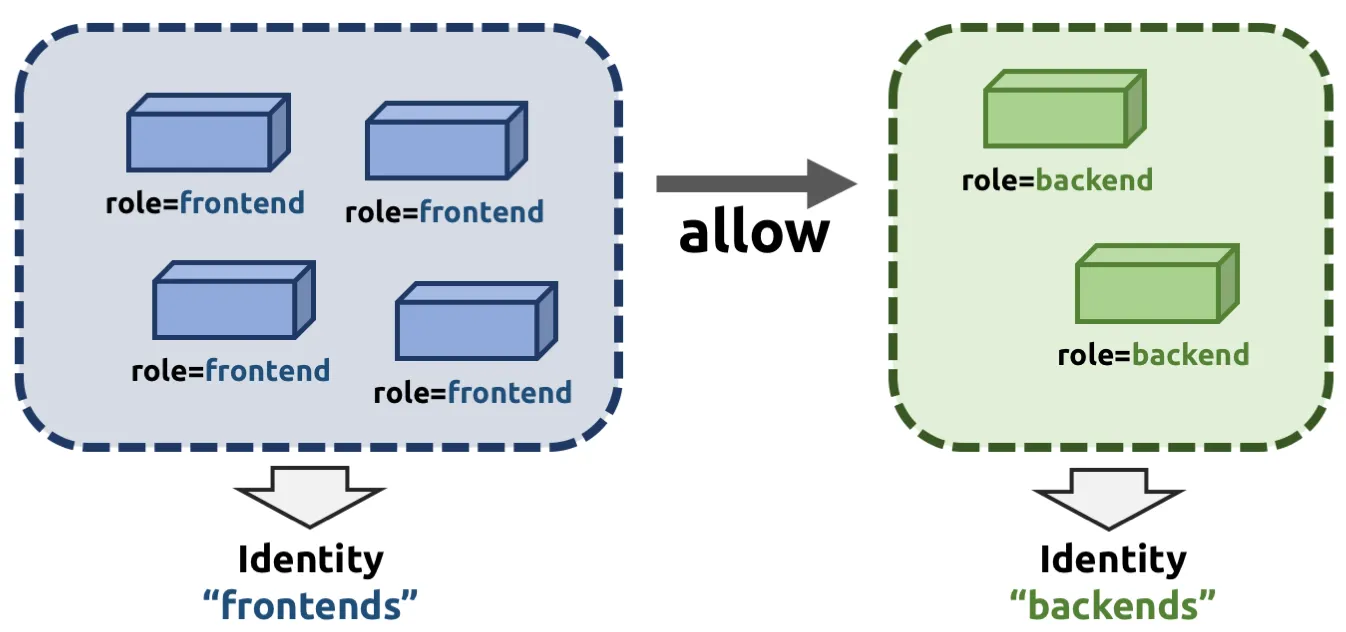 https://docs.cilium.io/en/stable/security/network/identity/
포트 기반 접근 제한
- Layer 4 포트 기반 제한: 들어오고 나가는 연결에 대해 접근 가능한 포트를 제한합니다. 예를 들어,
role=frontend레이블을 가진 엔드포인트는 포트 443(HTTPS)로만 나가는 연결이 가능하며,role=backend레이블을 가진 엔드포인트는 포트 443(HTTPS)로만 연결을 수락할 수 있습니다.
애플리케이션(HTTP) 기반 접근 제한
-
애플리케이션 프로토콜 수준의 세밀한 접근 제어: HTTP 및 원격 프로시저 호출(RPC) 프로토콜의 보안을 강화합니다. 예를 들어,
role=frontend레이블을 가진 엔드포인트는GET /userdata/[0-9]+형태의 REST API 호출만 허용하며, 다른 모든 API 인터랙션은role=backend와의 접근이 제한됩니다.- 프록시 주입: Envoy 사용
- 문서, Envoy
- Cilium은 모든 네트워크 연결에 Layer 4 프록시를 투명하게 주입할 수 있으며, 이를 기반으로 상위 레벨 네트워크 정책을 강제할 수 있습니다 (예: DNS 기반 정책 및 Layer 7 정책 예시 참조).
- 프록시 주입: Envoy 사용
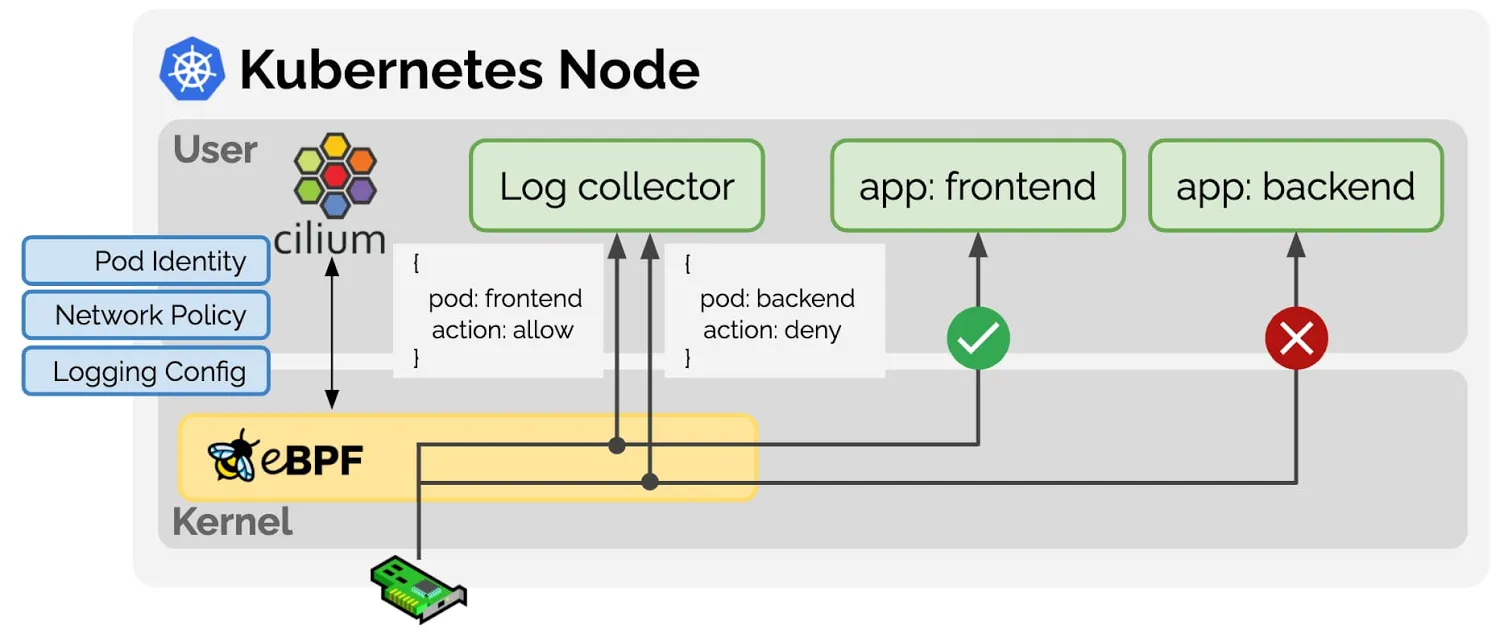
Network Policy 관련 eBPF Datapath
프리필터 (Prefilter)
- XDP 프로그램을 사용하여 네트워크에서 트래픽을 필터링하기 위한 프리필터 규칙을 제공하며, 최상의 성능을 목표로 합니다.
엔드포인트 정책 (Endpoint Policy)
- 정책에 따라 패킷을 차단하거나 전달하고, 서비스를 통해 전달하거나 L7(애플리케이션 레벨)로 정책을 전달할 수 있습니다.
- Cilium 데이터 경로는 패킷을 ID로 매핑하고 L3 및 L4 수준의 정책을 시행하는 역할을 담당합니다.
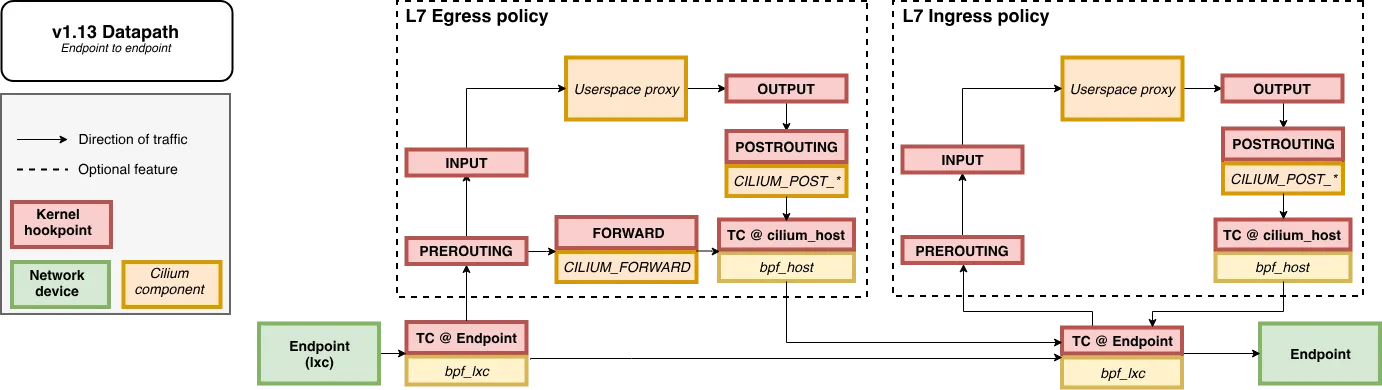
L7 정책 (L7 Policy)
- L7 정책 객체는 프록시 트래픽을 Cilium 사용자 공간(userspace) 프록시 인스턴스로 리다이렉트합니다. Cilium은 Envoy 인스턴스를 사용자 공간 프록시로 사용하며, Envoy는 트래픽을 전달하거나 설정된 L7 정책에 따라 적절한 거부 메시지를 생성합니다.
- L7 정책은 커널 훅포인트(hookpoint)와 사용자 공간 프록시(userspace proxy)를 사용하므로 성능이 약간 저하될 수 있습니다.
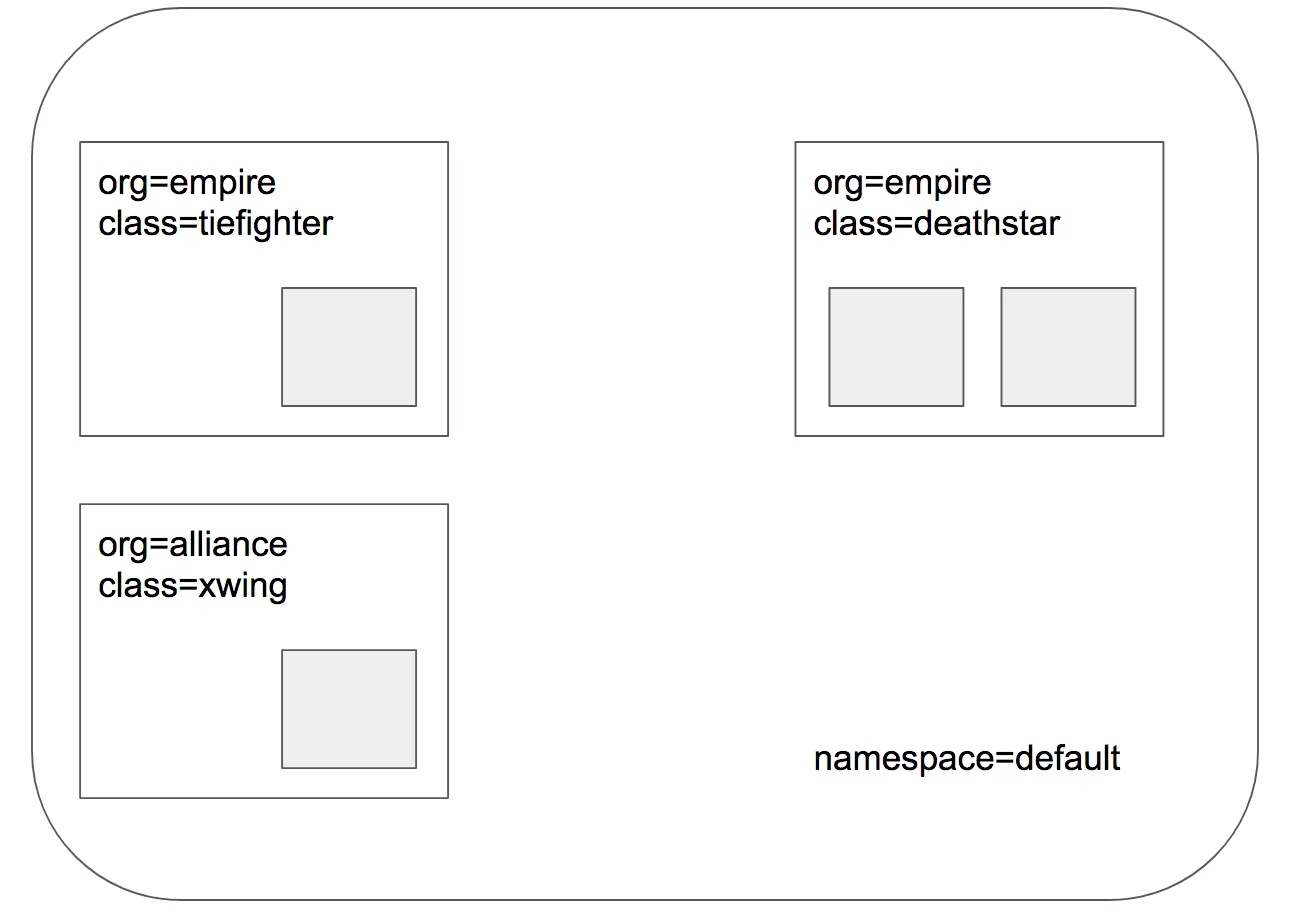
Deploy the Demo Application - Docs
- 스타워즈에서 영감 받은 예제 : 디플로이먼트(웹 서버, deathstar, replicas 2), 파드(xwing, tiefighter), 서비스(ClusterIP, service/deathstar)
# 배포
kubectl create -f https://raw.githubusercontent.com/cilium/cilium/1.16.3/examples/minikube/http-sw-app.yaml
kubectl get all

# 파드 라벨 확인
kubectl get pod --show-labels
NAME                         READY   STATUS    RESTARTS   AGE    LABELS
deathstar-689f66b57d-4rwkf   1/1     Running   0          113s   app.kubernetes.io/name=deathstar,class=deathstar,org=empire,pod-template-hash=689f66b57d
deathstar-689f66b57d-8p2l5   1/1     Running   0          113s   app.kubernetes.io/name=deathstar,class=deathstar,org=empire,pod-template-hash=689f66b57d
tiefighter                   1/1     Running   0          113s   app.kubernetes.io/name=tiefighter,class=tiefighter,org=empire
xwing                        1/1     Running   0          113s   app.kubernetes.io/name=xwing,class=xwing,org=alliance

# cilium endpoint 확인
kubectl get ciliumendpoints
c1 endpoint list
c2 endpoint list

# 데스스타 SVC(ClusterIP) 접속하여 웹 파드 연결 확인 >> Hubble UI 에서 실시간 확인해보자!
kubectl exec xwing -- curl -s -XPOST deathstar.default.svc.cluster.local/v1/request-landing
Ship landed

kubectl exec tiefighter -- curl -s -XPOST deathstar.default.svc.cluster.local/v1/request-landing
Ship landed

# 확인
hubble observe
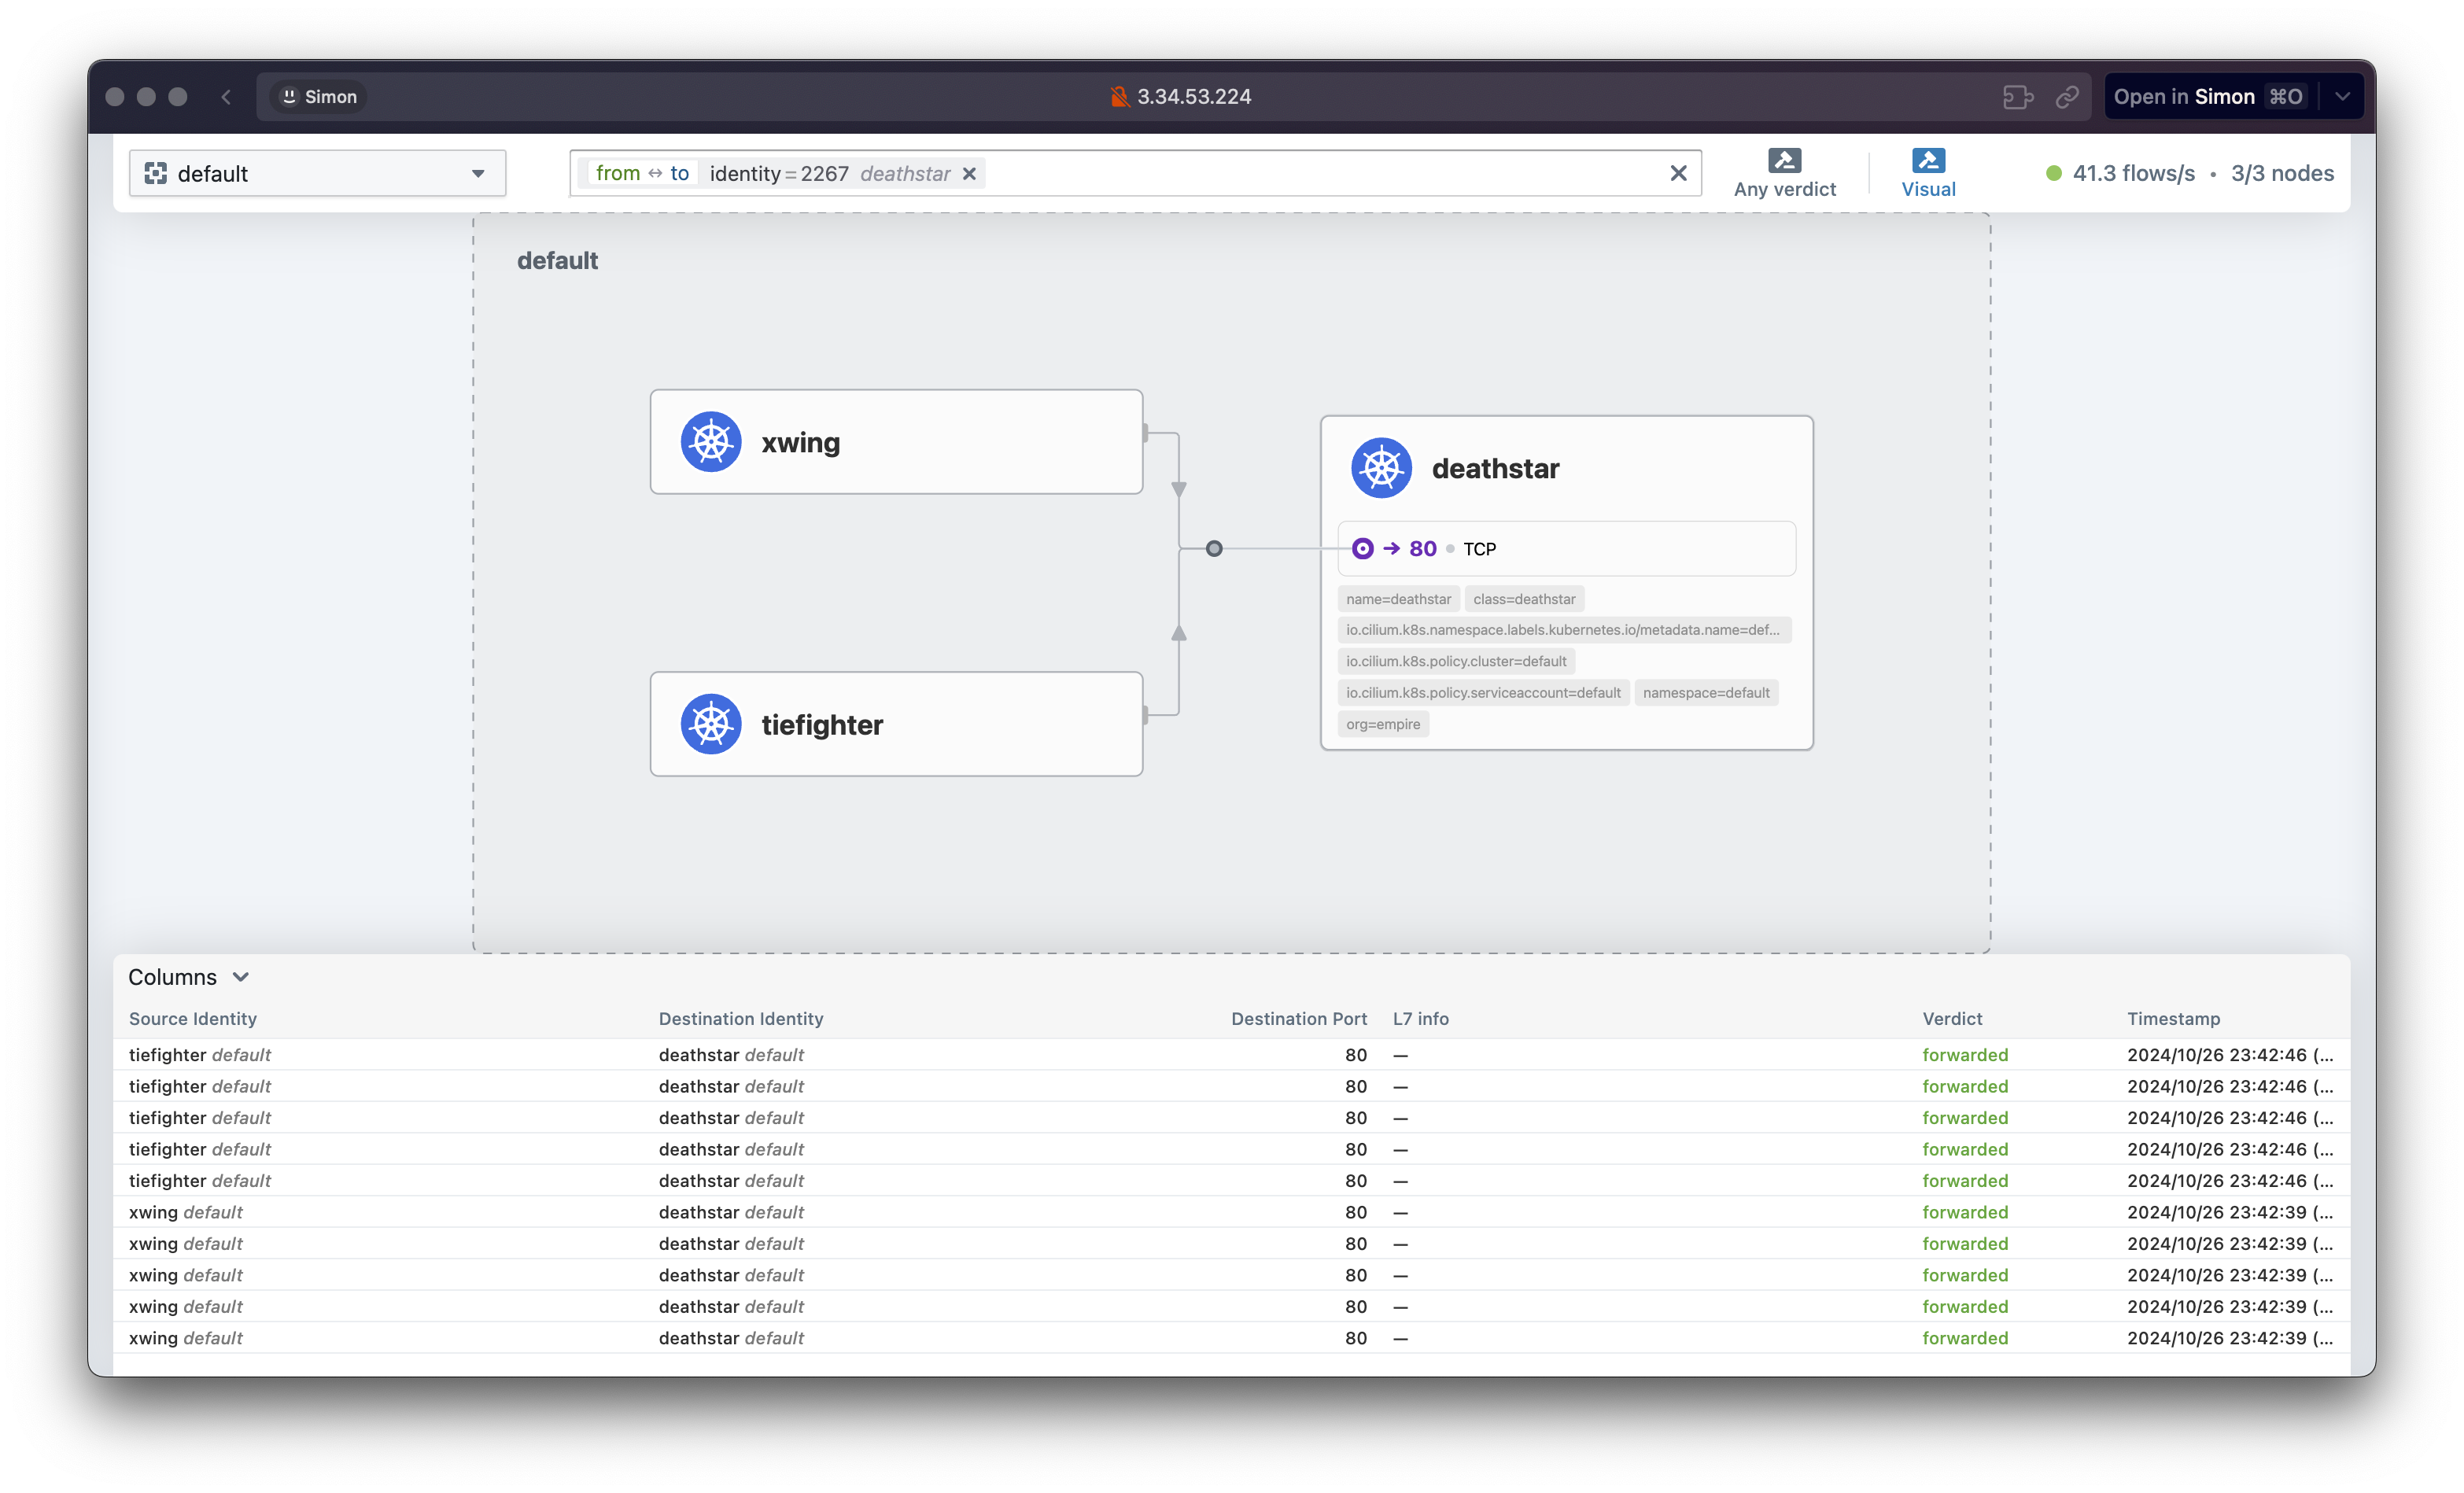
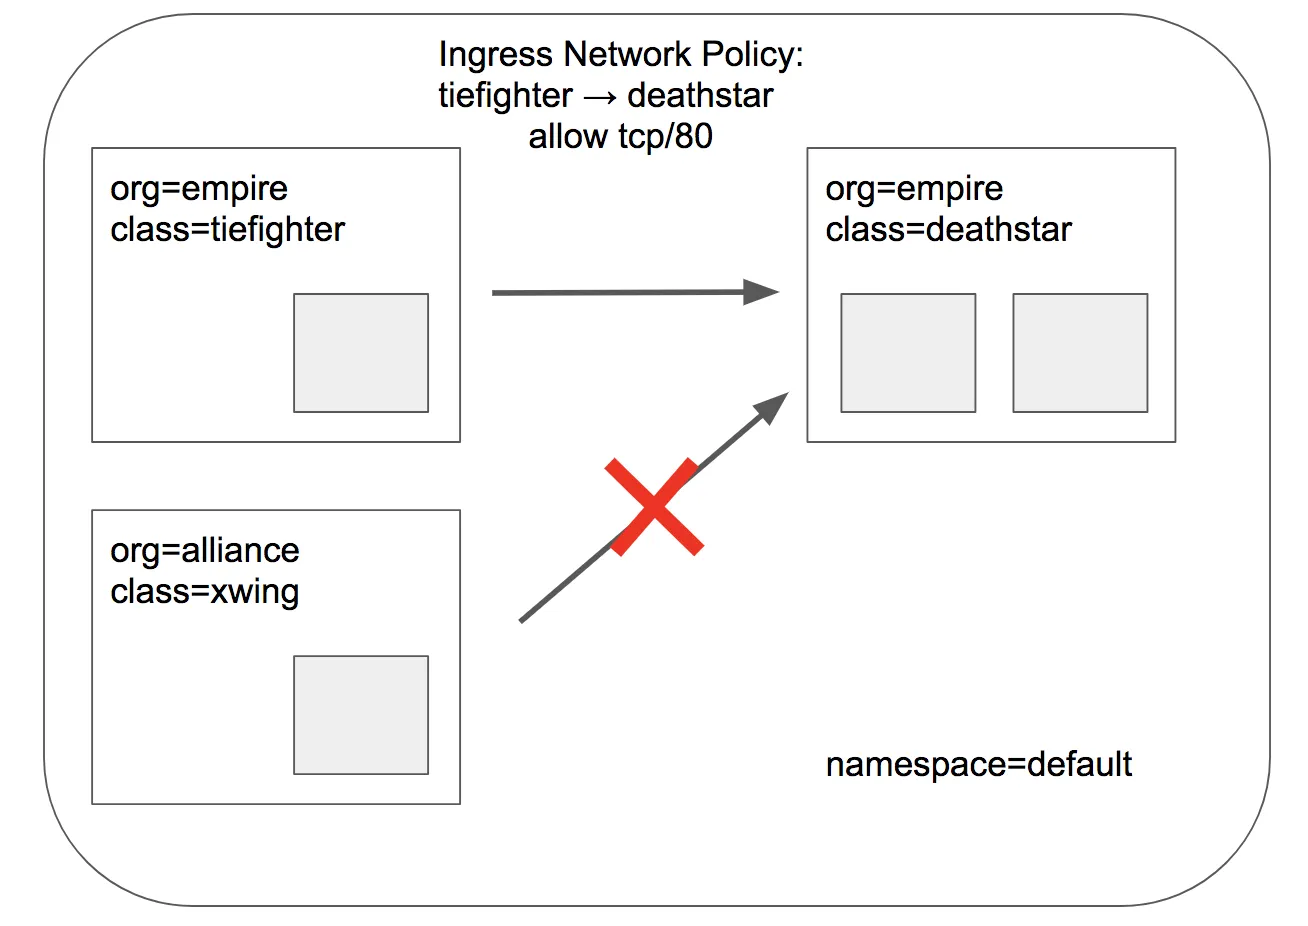
Identity-Aware and HTTP-Aware Policy Enforcement
Apply an L3/L4 Policy- Link & Hubble CLI - 링크
- Cilium 에서는 Endpoint IP 대신, 파드의 Labels(라벨)을 사용(기준)하여 보안 정책을 적용합니다
- IP/Port 필터링을 L3/L4 네트워크 정책이라고 한다
- 아래 처럼 'org=empire' Labels(라벨) 부착된 파드만 허용해보자
- Cilium performs stateful connection tracking 이므로 리턴 트래픽은 자동으로 허용됨
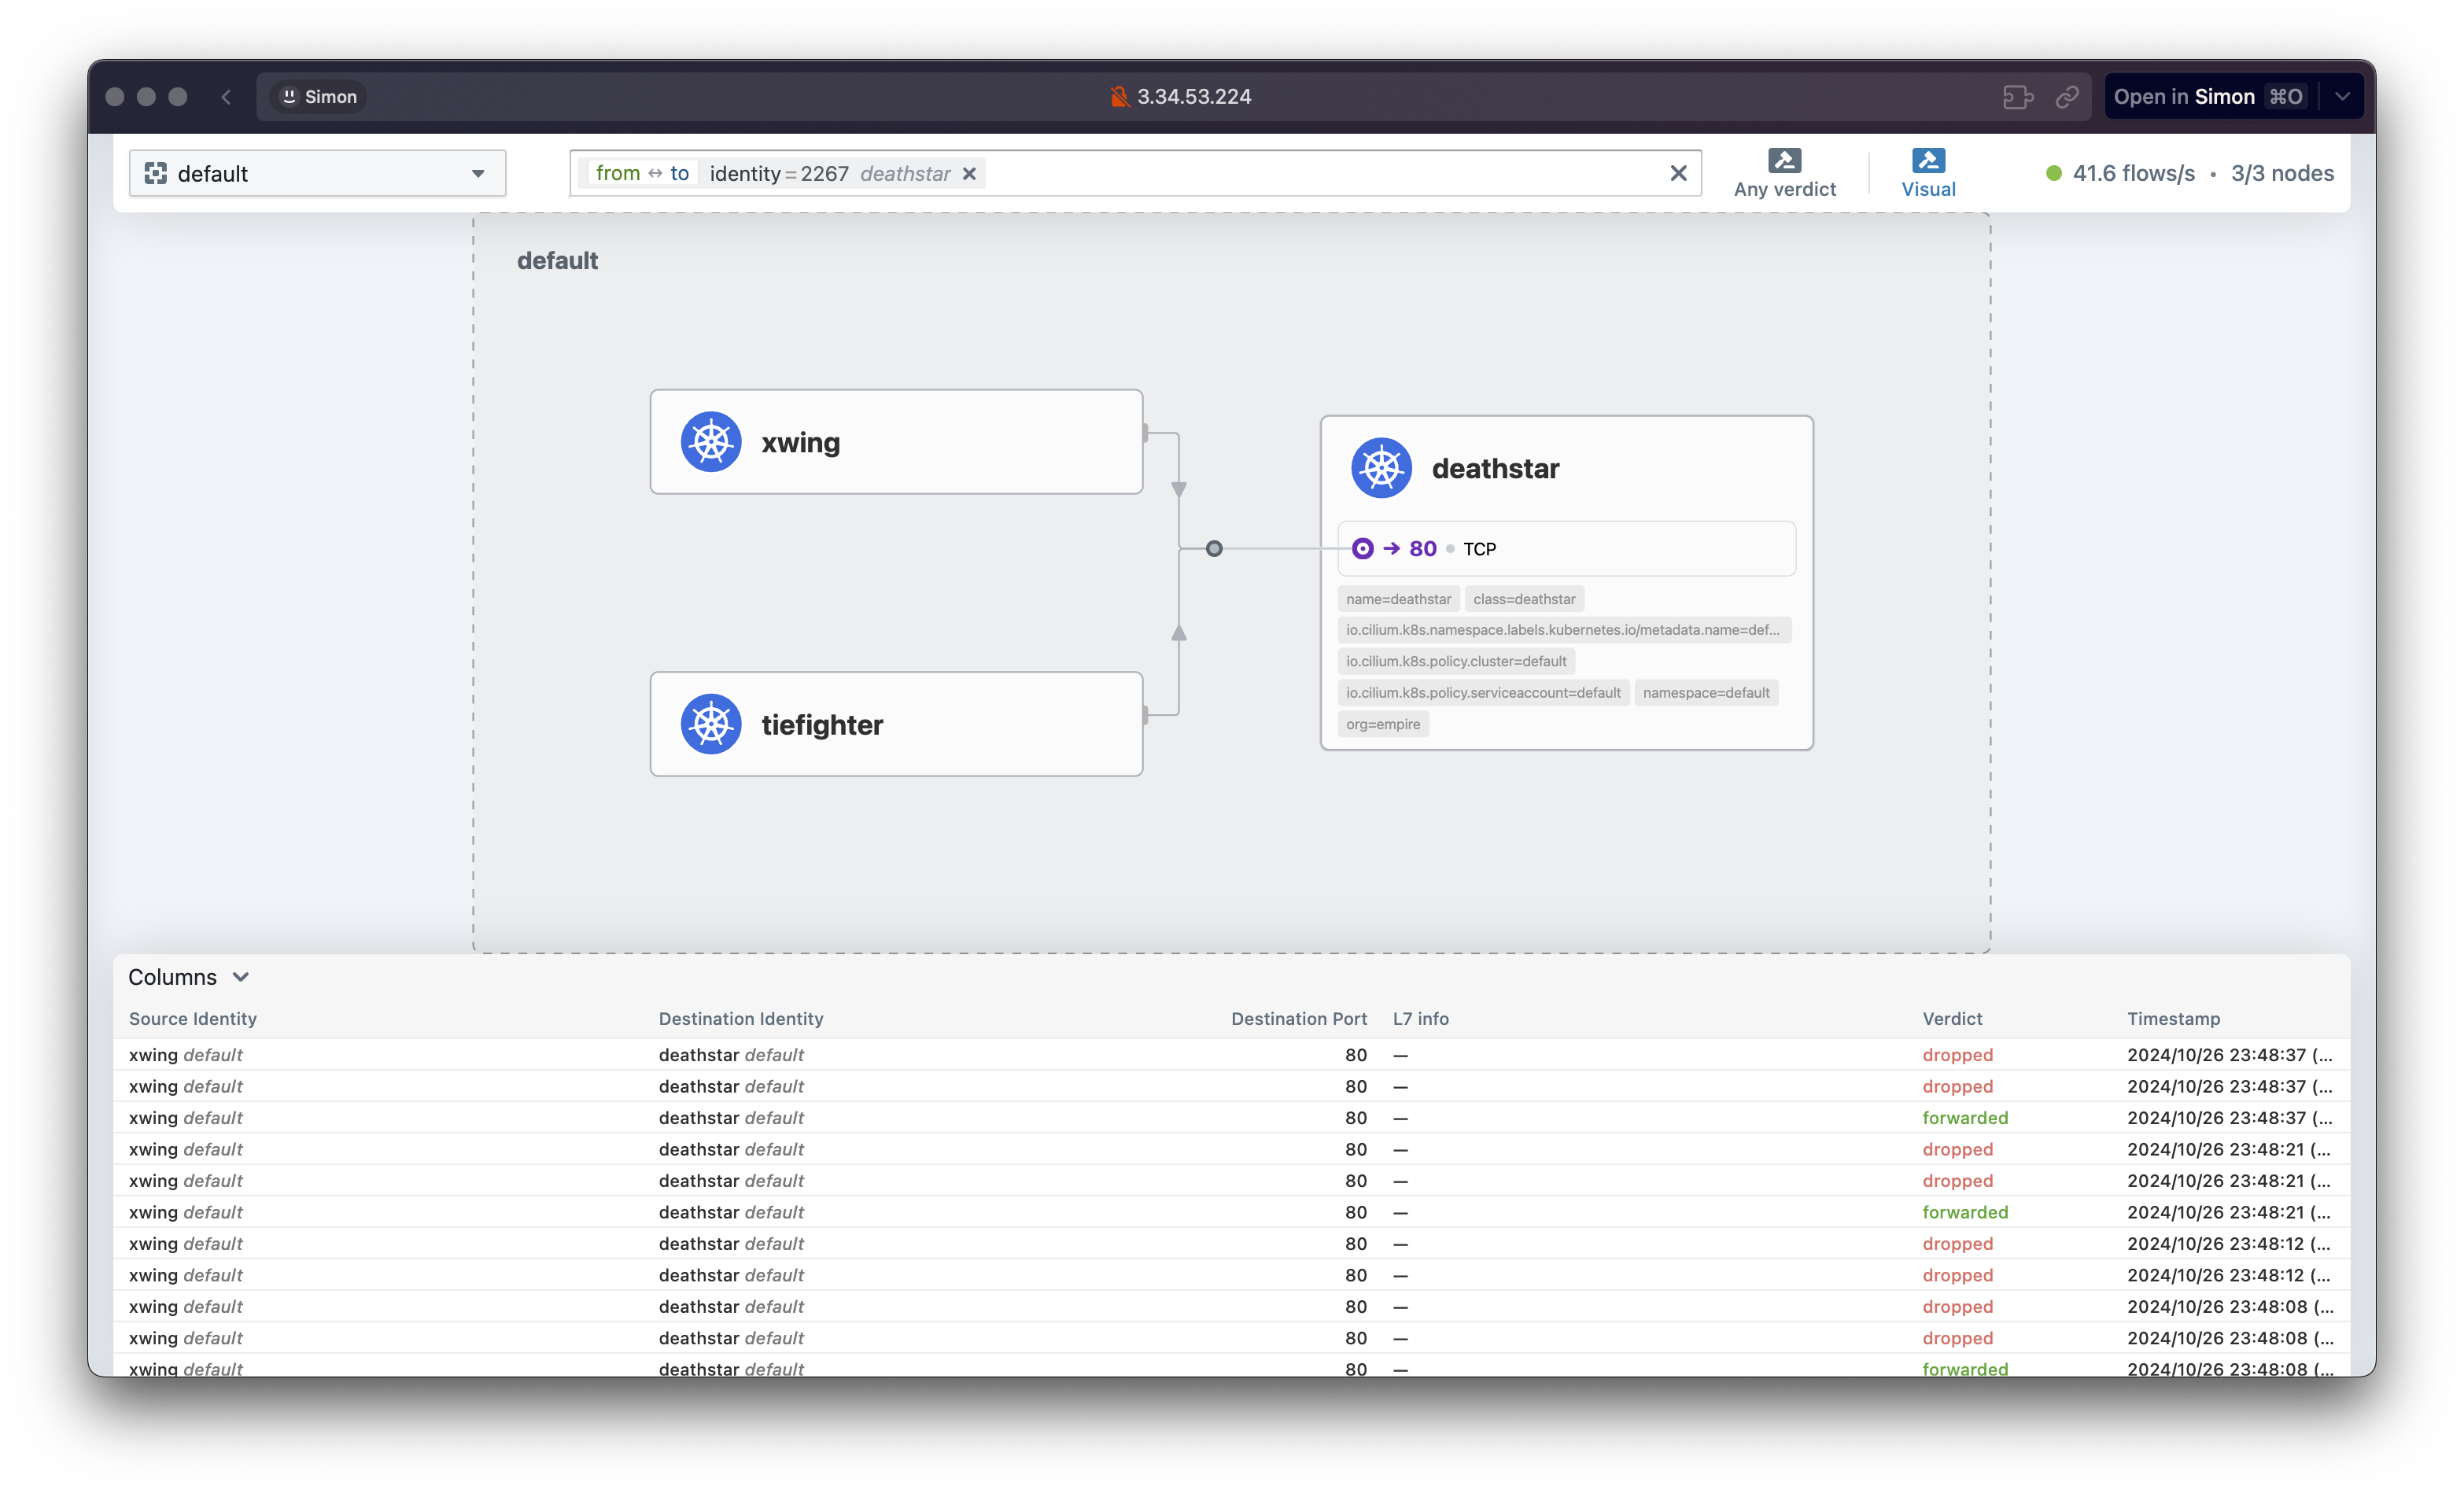
# L3/L4 정책 생성
cat <<EOF | kubectl apply -f -
apiVersion: "cilium.io/v2"
kind: CiliumNetworkPolicy
metadata:
  name: "rule1"
spec:
  description: "L3-L4 policy to restrict deathstar access to empire ships only"
  endpointSelector:
    matchLabels:
      org: empire
      class: deathstar
  ingress:
  - fromEndpoints:
    - matchLabels:
        org: empire
    toPorts:
    - ports:
      - port: "80"
        protocol: TCP
EOF

# 정책 확인
kubectl get cnp
kc describe cnp rule1
c0 policy get


# 파드 curl 접속 시도 시 파드 sh 접속 후 curl 시도하자!
# 데스스타 SVC(ClusterIP) 접속하여 웹 파드 연결 확인 >> Hubble UI 에서 drop 확인!
kubectl exec tiefighter -- curl -s -XPOST deathstar.default.svc.cluster.local/v1/request-landing
Ship landed

kubectl exec xwing -- curl -s -XPOST deathstar.default.svc.cluster.local/v1/request-landing
drop

# hubble cli 모니터링
hubble observe --pod xwing
hubble observe --pod tiefighter
hubble observe --pod deathstar
Dec  2 05:36:24.490: default/xwing:55464 <> default/deathstar-c74d84667-t7msh:80 Policy denied DROPPED (TCP Flags: SYN)
Dec  2 05:36:24.490: default/xwing:55464 <> default/deathstar-c74d84667-t7msh:80 Policy denied DROPPED (TCP Flags: SYN)

hubble observe --pod deathstar --verdict DROPPED
Nov 30 15:23:47.721: default/xwing:60086 <> default/deathstar-c74d84667-ksnbd:80 Policy denied DROPPED (TCP Flags: SYN)
Nov 30 15:23:47.721: default/xwing:60086 <> default/deathstar-c74d84667-ksnbd:80 Policy denied DROPPED (TCP Flags: SYN)
Nov 30 15:27:40.250: default/tiefighter:41656 -> default/deathstar-c74d84667-ksnbd:80 http-request DROPPED (HTTP/1.1 PUT http://deathstar.default.svc.cluster.local/v1/exhaust-port)
Nov 30 15:28:00.707: default/tiefighter:41666 -> default/deathstar-c74d84667-ksnbd:80 http-request DROPPED (HTTP/1.1 PUT http://deathstar.default.svc.cluster.local/v1/exhaust-port)

Inspecting the Policy
# If we run cilium endpoint list again we will see that the pods with the label org=empire and class=deathstar
# now have ingress policy enforcement enabled as per the policy above.

# endpoint list 에서 정책 적용 확인
c1 endpoint list | grep deathstar
c2 endpoint list
ENDPOINT   POLICY (ingress)   POLICY (egress)   IDENTITY   LABELS (source:key[=value])                                              IPv6   IPv4           STATUS
           ENFORCEMENT        ENFORCEMENT
312        Disabled           Disabled          18300      k8s:class=xwing                                                                 172.16.2.161   ready
                                                          k8s:io.cilium.k8s.namespace.labels.kubernetes.io/metadata.name=default
                                                          k8s:io.cilium.k8s.policy.cluster=default
                                                          k8s:io.cilium.k8s.policy.serviceaccount=default
                                                          k8s:io.kubernetes.pod.namespace=default
                                                          k8s:org=alliance

1972       Enabled            Disabled          21144      k8s:class=deathstar                                                             172.16.2.66    ready
                                                           k8s:io.cilium.k8s.namespace.labels.kubernetes.io/metadata.name=default
                                                           k8s:io.cilium.k8s.policy.cluster=default
                                                           k8s:io.cilium.k8s.policy.serviceaccount=default
                                                           k8s:io.kubernetes.pod.namespace=default
                                                           k8s:org=empirec2 endpoint list
Identity-Aware and HTTP-Aware Policy Enforcement
Apply and Test HTTP-aware L7 Policy- Docs
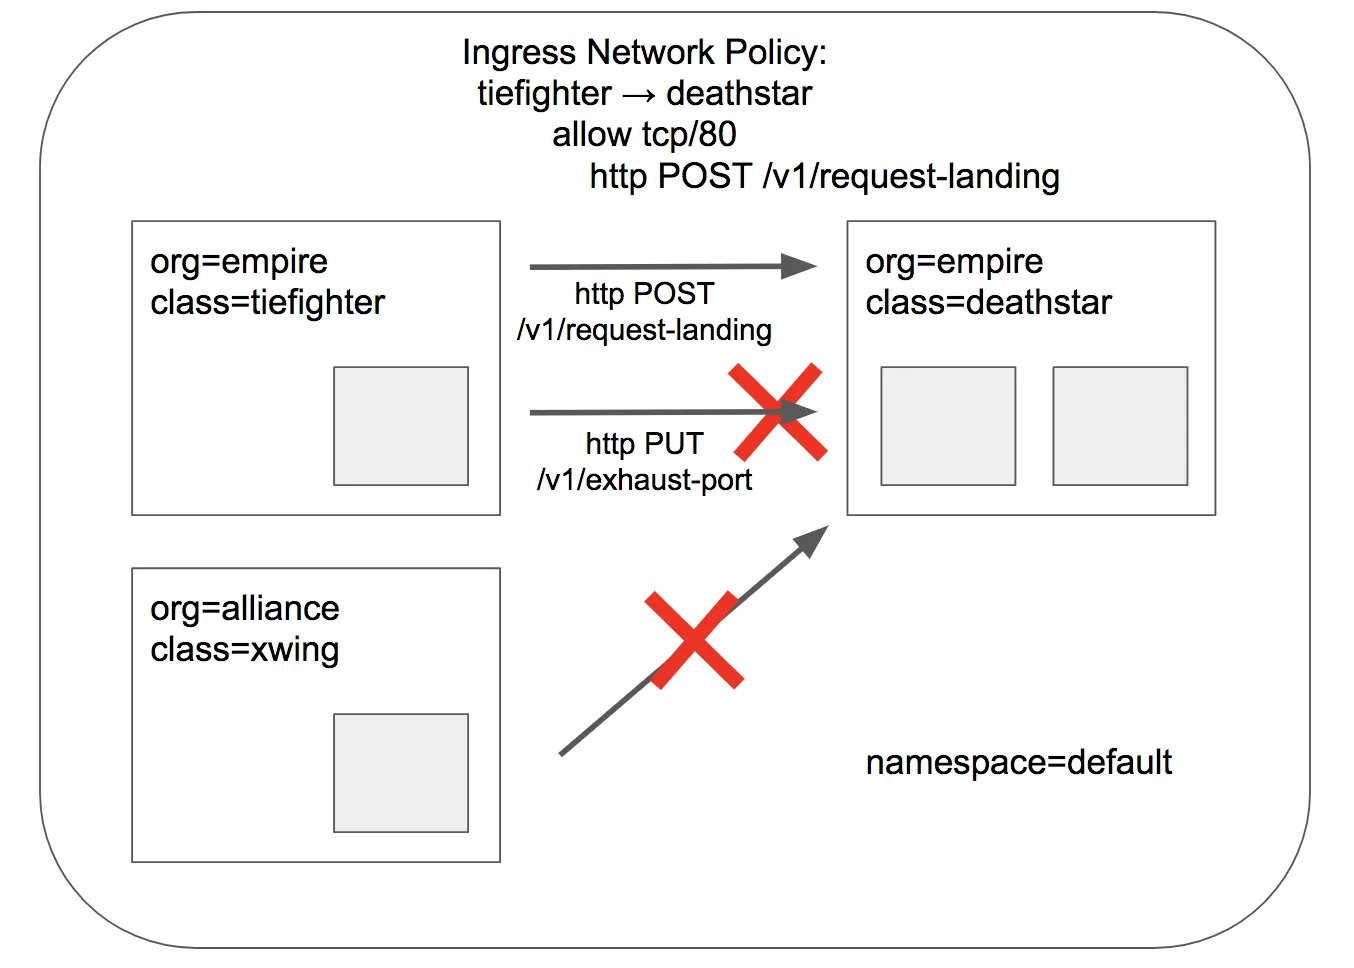
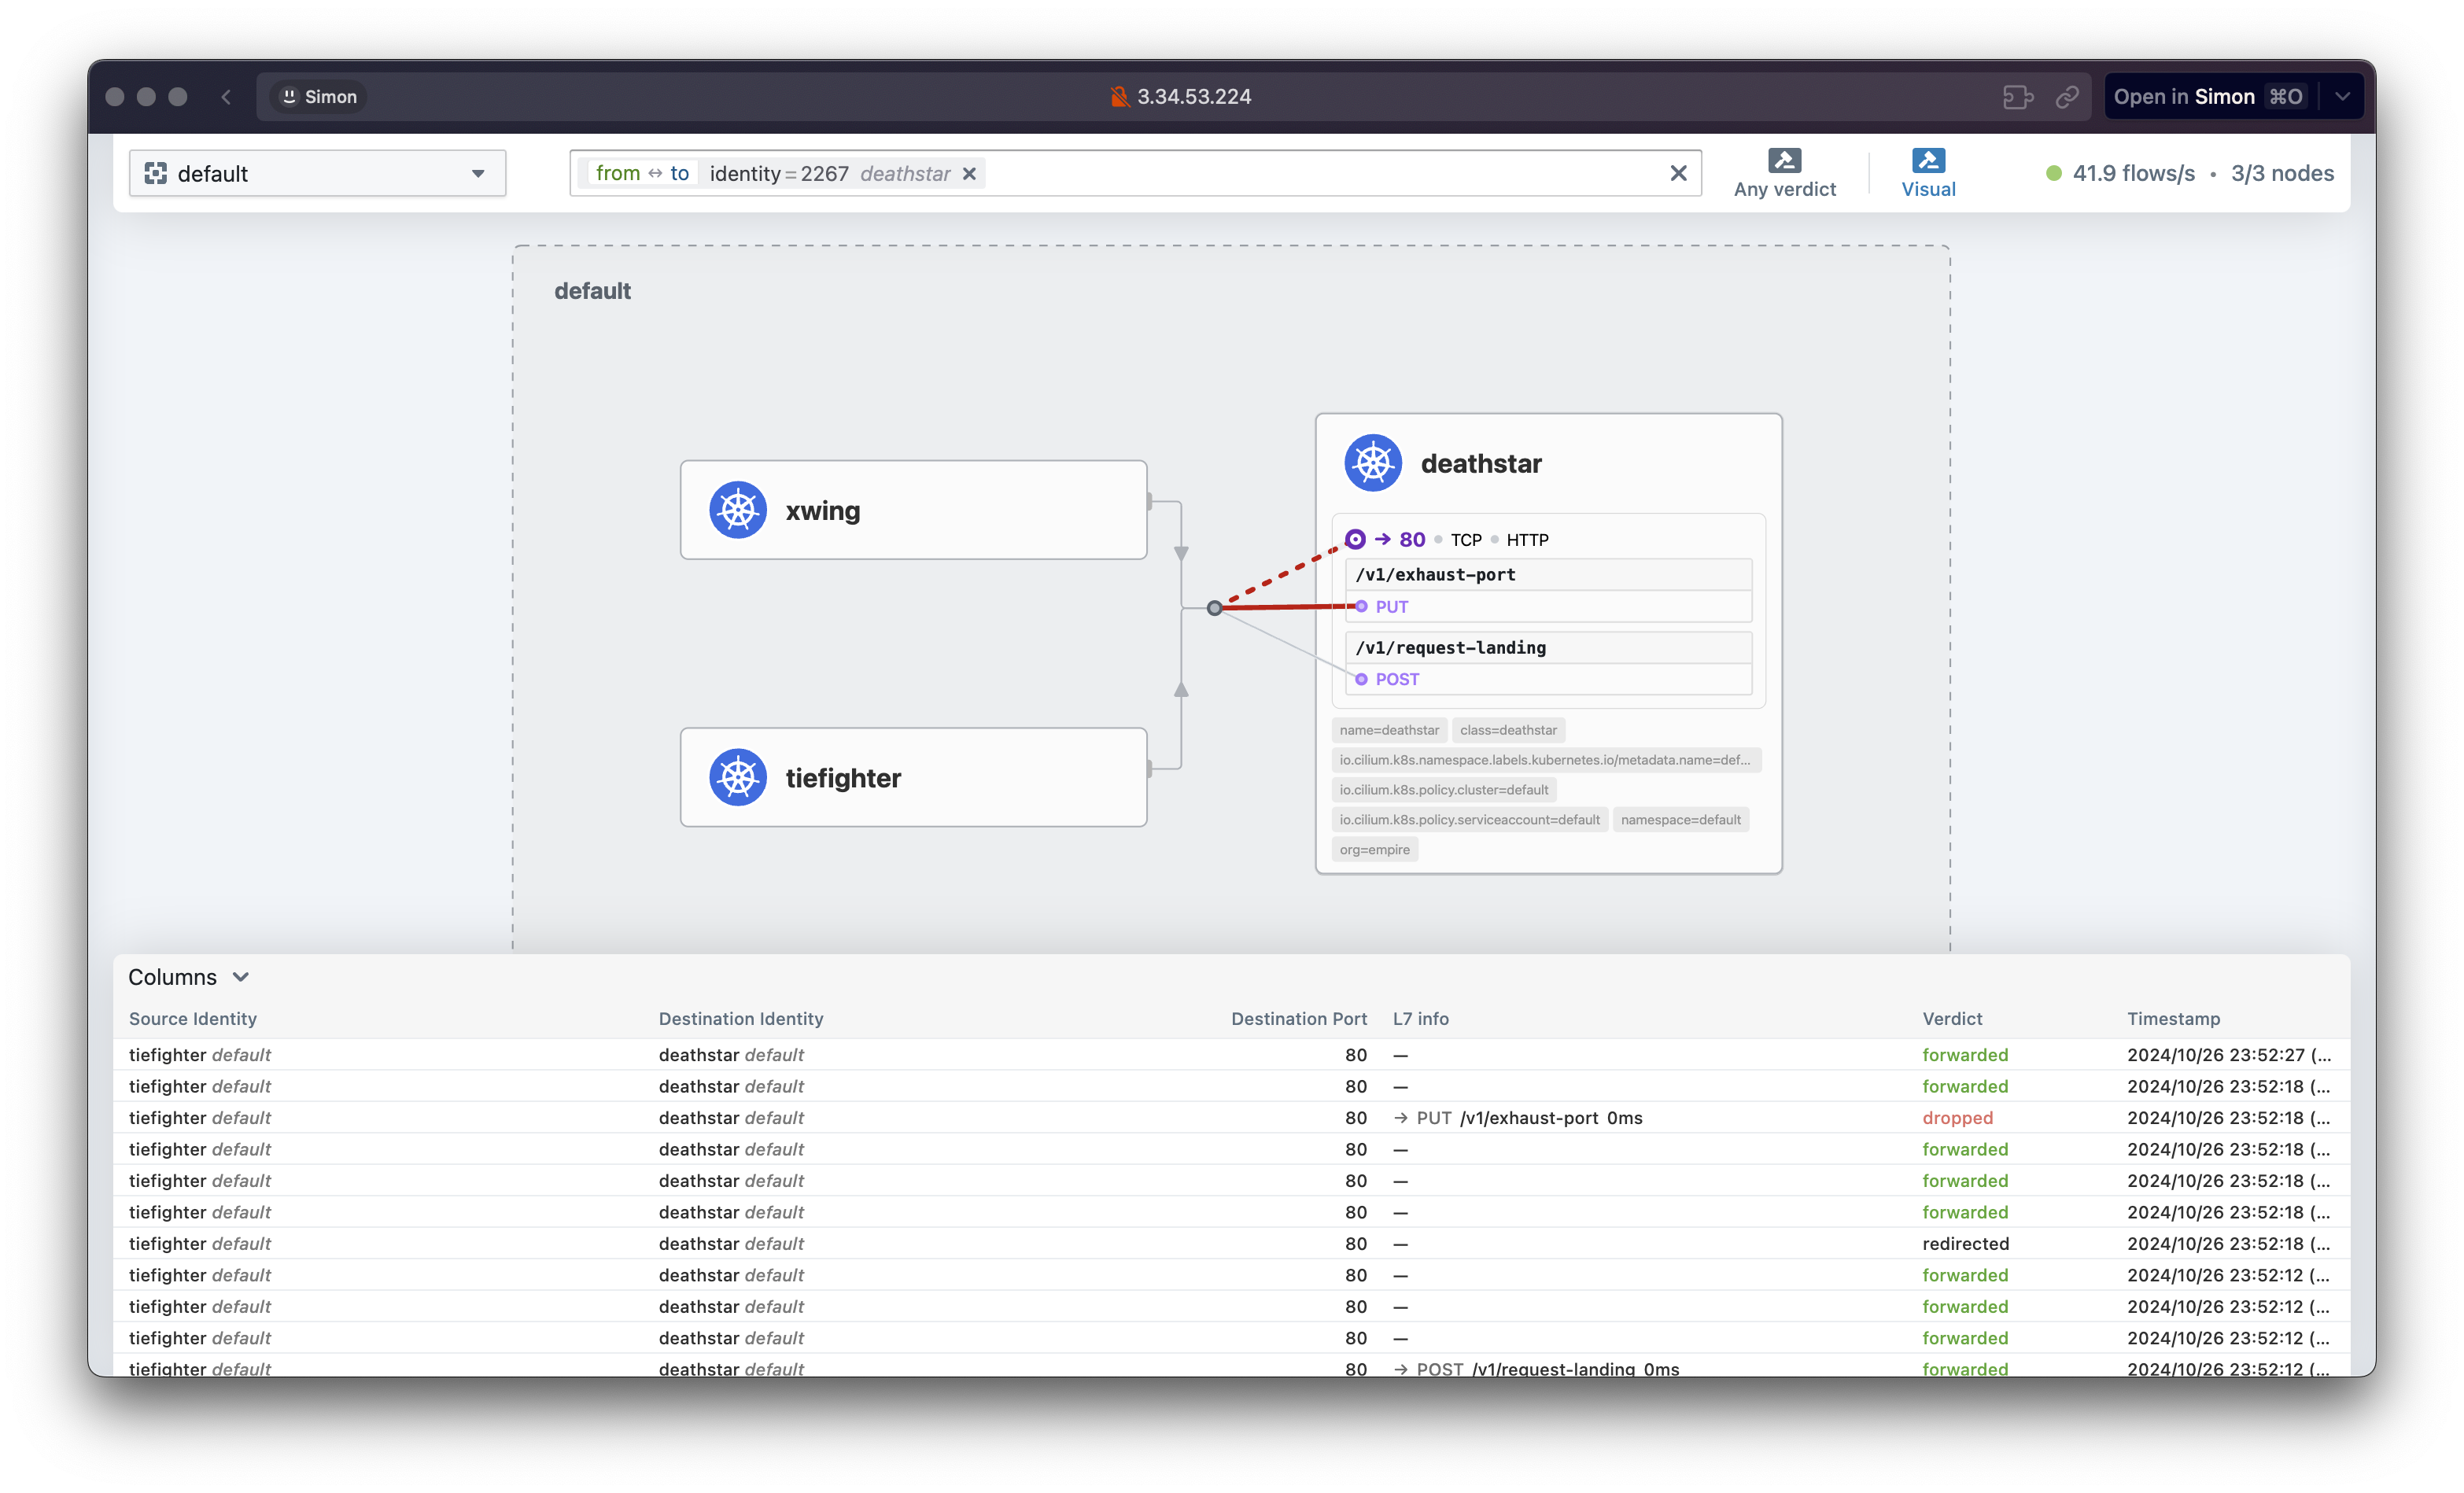
- HTTP L7 필터링을 적용 : 아래 처럼 PUT /v1/exhaust-port 요청을 차단!
# 데스스타 SVC(ClusterIP) 접속
kubectl exec tiefighter -- curl -s -XPUT deathstar.default.svc.cluster.local/v1/exhaust-port
Panic: deathstar exploded
...

# POST /v1/request-landing API 호출만 허용 정책으로 기존 정책 내용을 업데이트(configured)!
cat <<EOF | kubectl apply -f -
apiVersion: "cilium.io/v2"
kind: CiliumNetworkPolicy
metadata:
  name: "rule1"
spec:
  description: "L7 policy to restrict access to specific HTTP call"
  endpointSelector:
    matchLabels:
      org: empire
      class: deathstar
  ingress:
  - fromEndpoints:
    - matchLabels:
        org: empire
    toPorts:
    - ports:
      - port: "80"
        protocol: TCP
      rules:
        http:
        - method: "POST"
          path: "/v1/request-landing"
EOF

# 정책 확인
kc describe ciliumnetworkpolicies
c0 policy get

# 모니터링
c1 monitor -v --type l7
c2 monitor -v --type l7
<- Request http from 0 ([k8s:io.cilium.k8s.policy.cluster=default k8s:io.cilium.k8s.policy.serviceaccount=default k8s:io.kubernetes.pod.namespace=default k8s:org=empire k8s:class=tiefighter k8s:io.cilium.k8s.namespace.labels.kubernetes.io/metadata.name=default]) to 1972 ([k8s:class=deathstar k8s:org=empire k8s:io.cilium.k8s.namespace.labels.kubernetes.io/metadata.name=default k8s:io.kubernetes.pod.namespace=default k8s:io.cilium.k8s.policy.serviceaccount=default k8s:io.cilium.k8s.policy.cluster=default]), identity 42720->21144, verdict Denied PUT http://deathstar.default.svc.cluster.local/v1/exhaust-port => 403
 => 403
hubble observe --pod deathstar
hubble observe --pod deathstar --verdict DROPPED


# 접근 테스트
kubectl exec tiefighter -- curl -s -XPOST deathstar.default.svc.cluster.local/v1/request-landing
Ship landed

kubectl exec tiefighter -- curl -s -XPUT deathstar.default.svc.cluster.local/v1/exhaust-port
Access denied

## hubble cli 에 차단 로그 확인
hubble observe --pod deathstar --verdict DROPPED
Feb 28 11:39:59.078: default/tiefighter:33762 -> default/deathstar-c74d84667-lf2wl:80 http-request DROPPED (HTTP/1.1 PUT http://deathstar.default.svc.cluster.local/v1/exhaust-port)

hubble observe --pod deathstar --protocol http
Feb 28 12:05:22.095: default/tiefighter:40428 -> default/deathstar-6f87496b94-cvv9r:80 http-request DROPPED (HTTP/1.1 PUT http://deathstar.default.svc.cluster.local/v1/exhaust-port)

# 삭제
kubectl delete -f https://raw.githubusercontent.com/cilium/cilium/1.16.3/examples/minikube/http-sw-app.yaml
kubectl delete cnp rule1
👉 Step 06. Bandwidth Manager
Bandwidth Manager : Bandwidth and Latency Optimization - Link , Home , Youtube
https://cilium.io/use-cases/bandwidth-optimization/
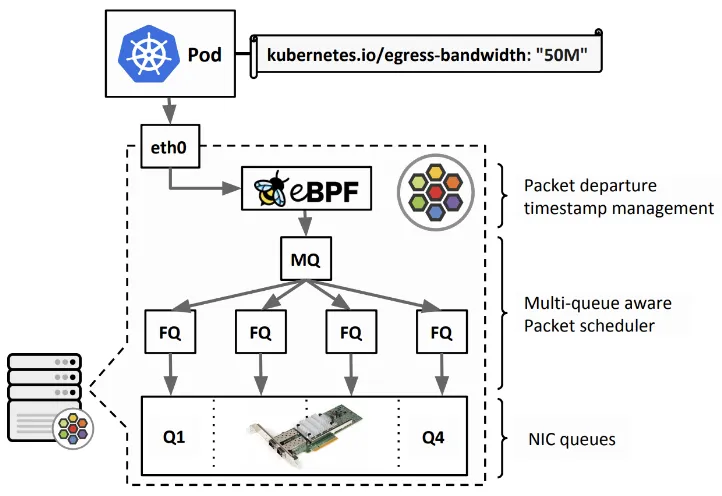
- bandwidth manager to optimize TCP and UDP workloads and efficiently rate limit individual Pods - EDT((Earliest Departure Time) 와 eBPF 사용
kubernetes.io/egress-bandwidthPod annotation which is enforced on egress at the native host networking devices.annotation is not supportedkubernetes.io/ingress-bandwidth- direct routing mode, tunneling mode 둘 다 지원
- Limitations : L7 Cilium Network Policies
설정 및 확인
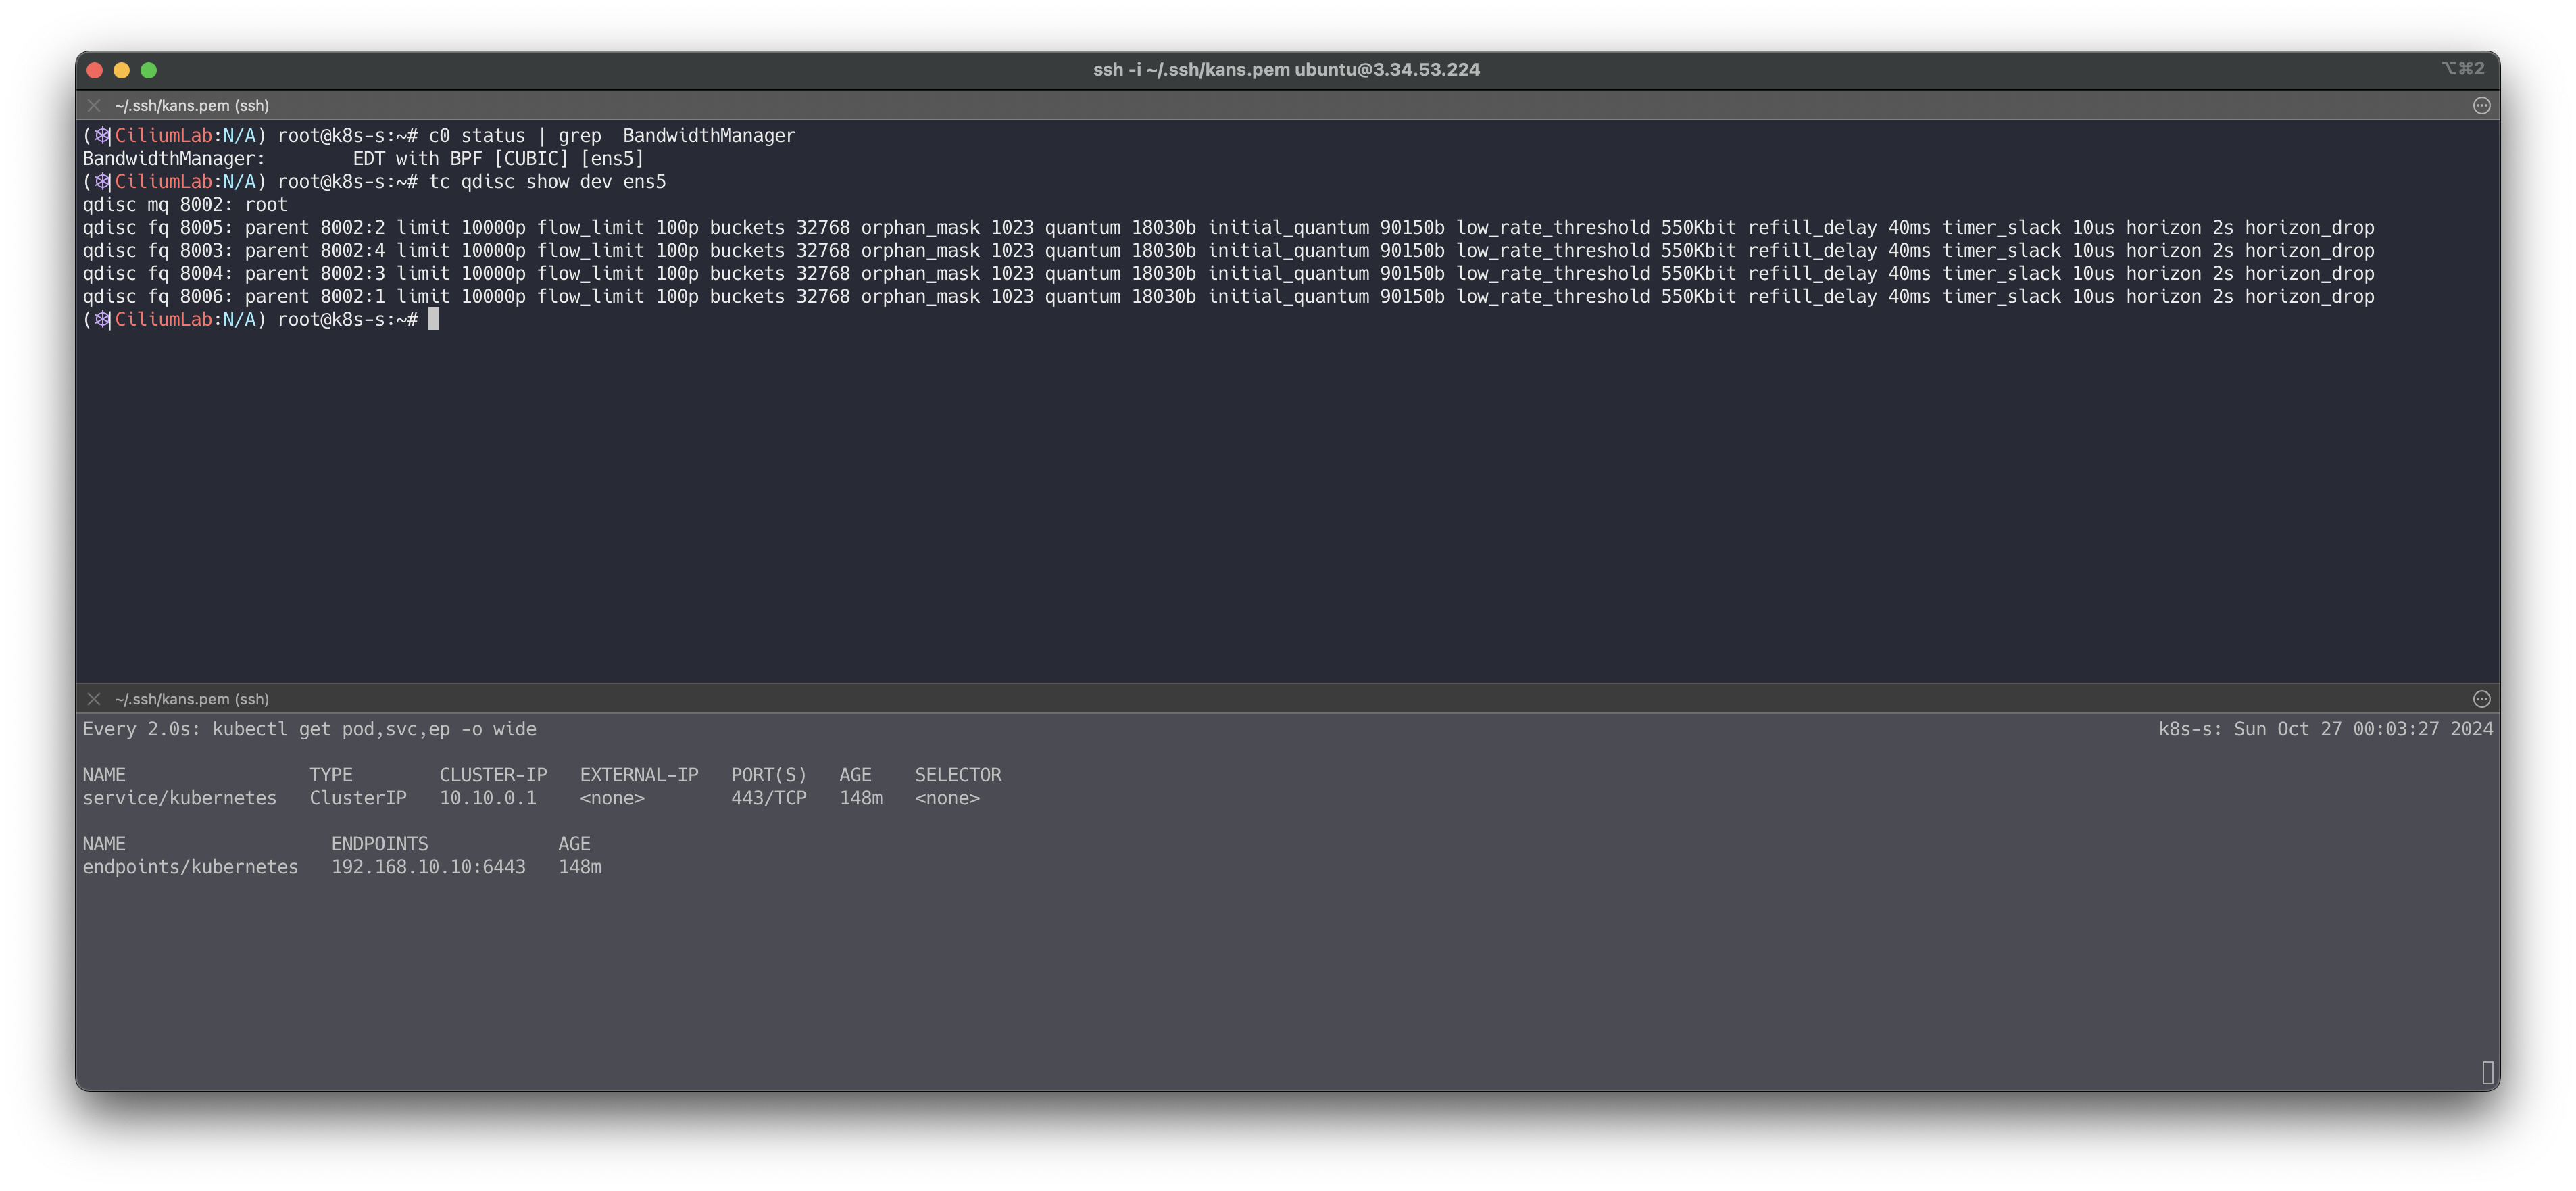
# 인터페이스 tc qdisc 확인
tc qdisc show dev ens5
qdisc mq 0: root
qdisc fq_codel 0: parent :4 limit 10240p flows 1024 quantum 1514 target 5ms interval 100ms memory_limit 32Mb ecn drop_batch 64
qdisc fq_codel 0: parent :3 limit 10240p flows 1024 quantum 1514 target 5ms interval 100ms memory_limit 32Mb ecn drop_batch 64
qdisc fq_codel 0: parent :2 limit 10240p flows 1024 quantum 1514 target 5ms interval 100ms memory_limit 32Mb ecn drop_batch 64
qdisc fq_codel 0: parent :1 limit 10240p flows 1024 quantum 1514 target 5ms interval 100ms memory_limit 32Mb ecn drop_batch 64

# 설정
helm upgrade cilium cilium/cilium --namespace kube-system --reuse-values --set bandwidthManager.enabled=true

# 적용 확인
cilium config view | grep bandwidth
enable-bandwidth-manager                       true

# egress bandwidth limitation 동작하는 인터페이스 확인
c0 status | grep  BandwidthManager
BandwidthManager:        EDT with BPF [CUBIC] [ens5]

# 인터페이스 tc qdisc 확인 : 설정 전후 옵션값들이 상당히 추가된다
tc qdisc
tc qdisc show dev ens5
qdisc mq 8002: root
qdisc fq 8005: parent 8002:2 limit 10000p flow_limit 100p buckets 32768 orphan_mask 1023 quantum 18030b initial_quantum 90150b low_rate_threshold 550Kbit refill_delay 40ms timer_slack 10us horizon 2s horizon_drop
qdisc fq 8003: parent 8002:4 limit 10000p flow_limit 100p buckets 32768 orphan_mask 1023 quantum 18030b initial_quantum 90150b low_rate_threshold 550Kbit refill_delay 40ms timer_slack 10us horizon 2s horizon_drop
qdisc fq 8004: parent 8002:3 limit 10000p flow_limit 100p buckets 32768 orphan_mask 1023 quantum 18030b initial_quantum 90150b low_rate_threshold 550Kbit refill_delay 40ms timer_slack 10us horizon 2s horizon_drop
qdisc fq 8006: parent 8002:1 limit 10000p flow_limit 100p buckets 32768 orphan_mask 1023 quantum 18030b initial_quantum 90150b low_rate_threshold 550Kbit refill_delay 40ms timer_slack 10us horizon 2s horizon_drop
동작 및 확인
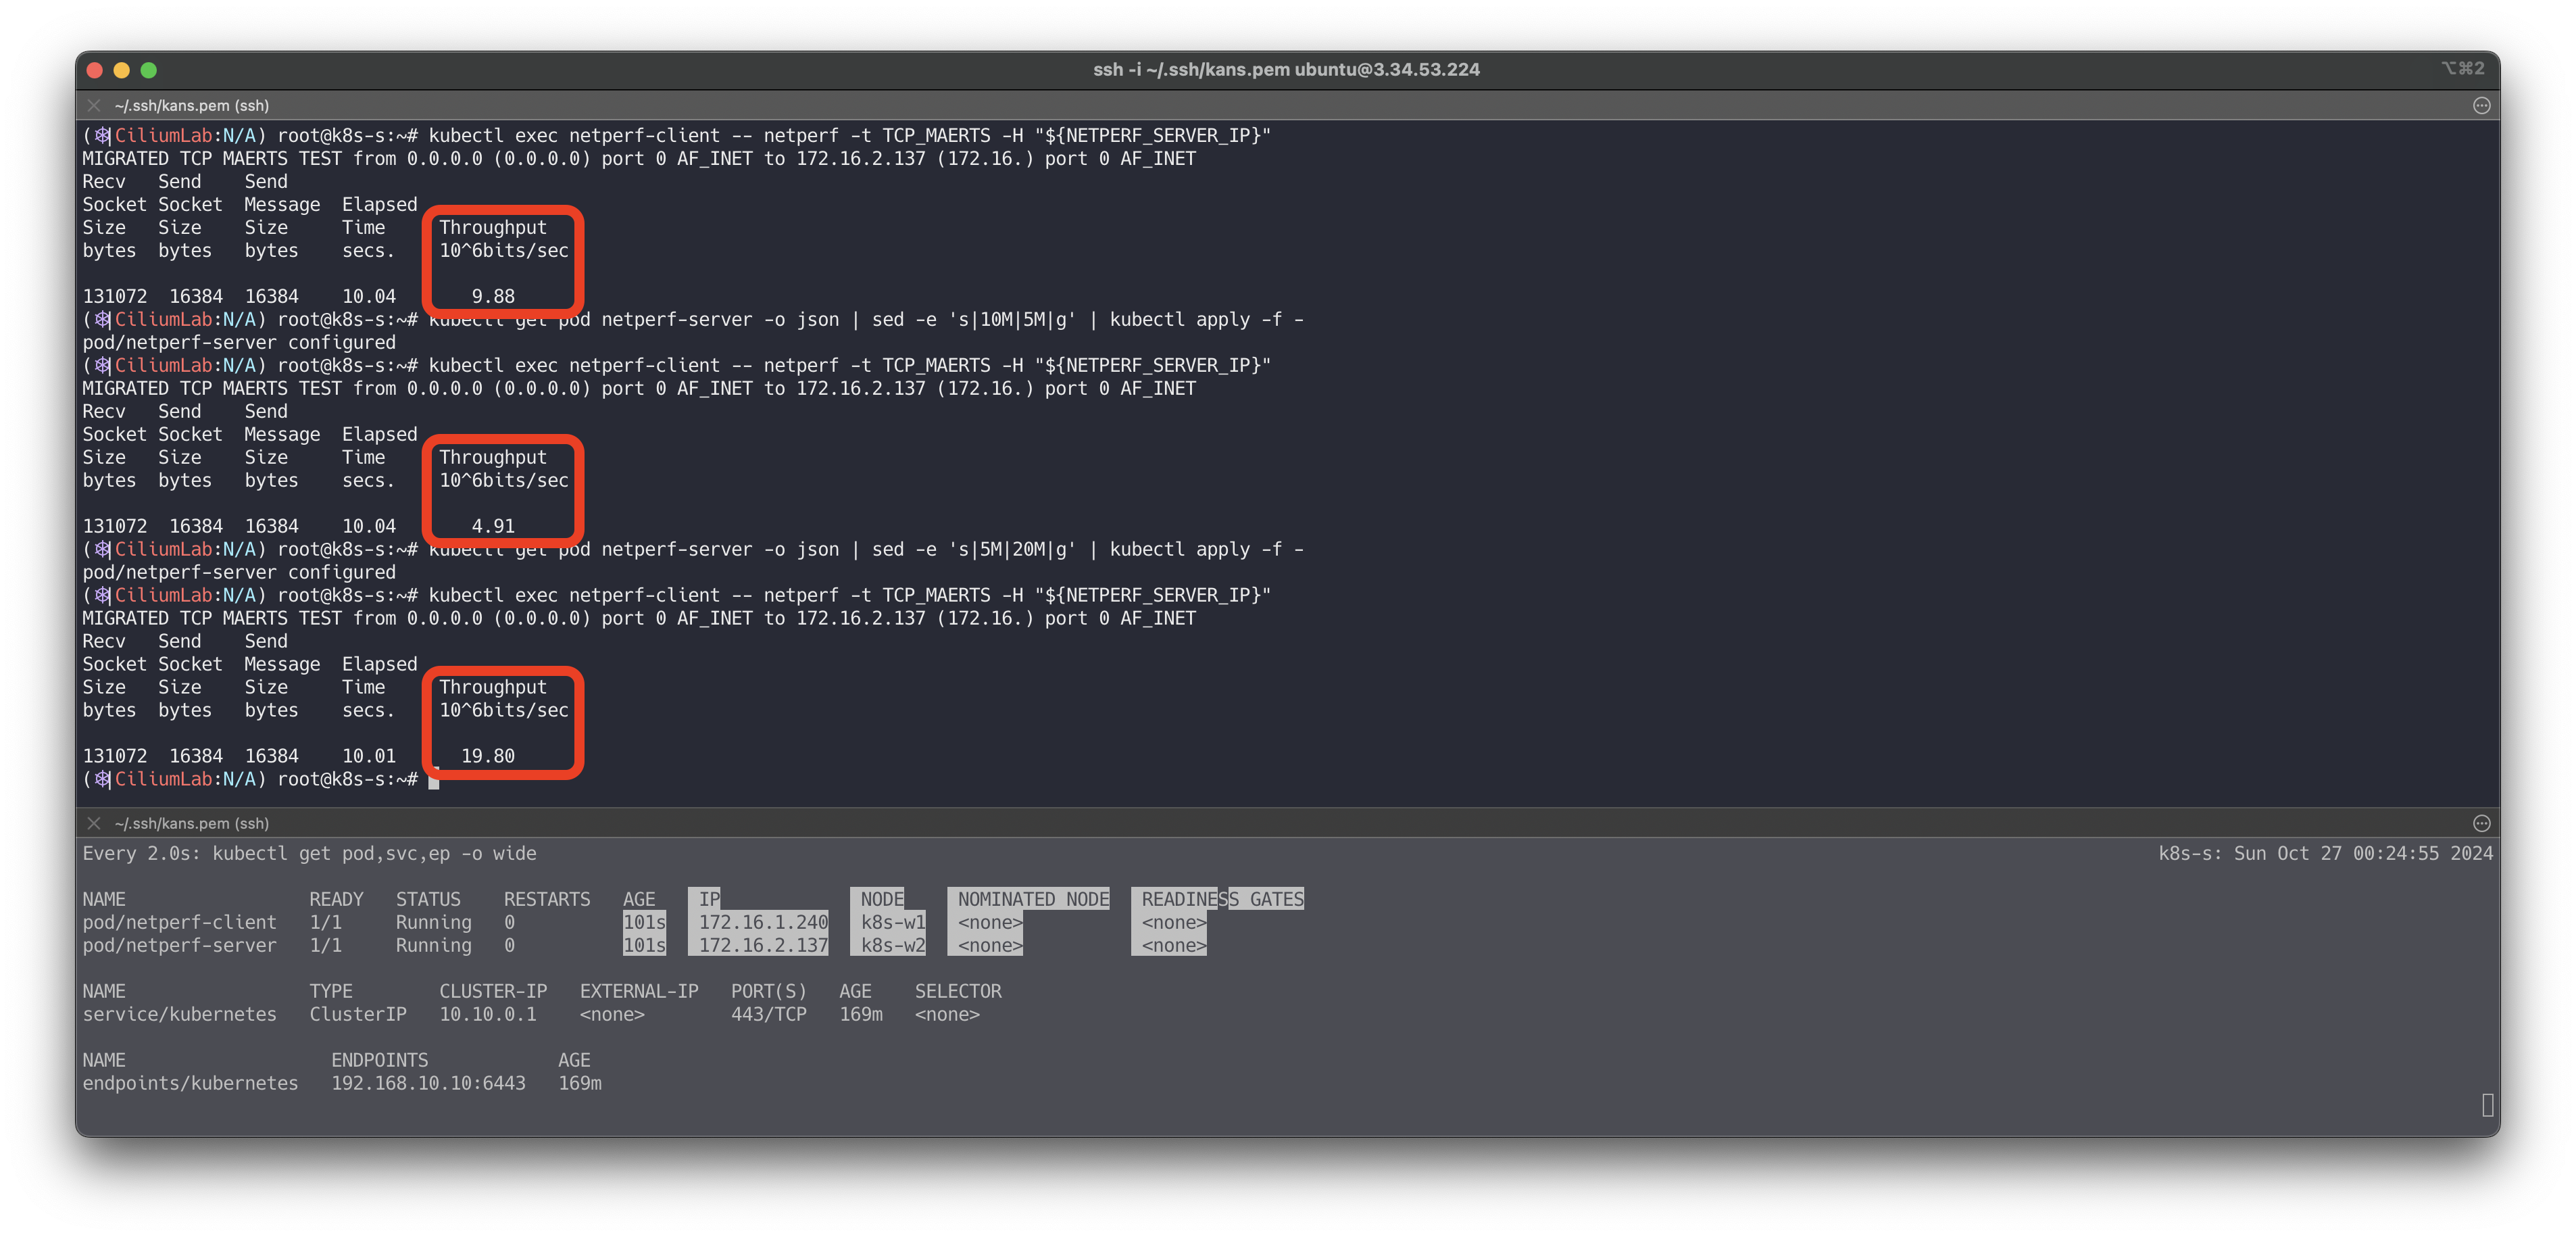
# 테스트를 위한 트래픽 발생 서버/클라이언트 파드 생성
cat <<EOF | kubectl apply -f -
---
apiVersion: v1
kind: Pod
metadata:
  annotations:
    # Limits egress bandwidth to 10Mbit/s.
    kubernetes.io/egress-bandwidth: "10M"
  labels:
    # This pod will act as server.
    app.kubernetes.io/name: netperf-server
  name: netperf-server
spec:
  containers:
  - name: netperf
    image: cilium/netperf
    ports:
    - containerPort: 12865
---
apiVersion: v1
kind: Pod
metadata:
  # This Pod will act as client.
  name: netperf-client
spec:
  affinity:
    # Prevents the client from being scheduled to the
    # same node as the server.
    podAntiAffinity:
      requiredDuringSchedulingIgnoredDuringExecution:
      - labelSelector:
          matchExpressions:
          - key: app.kubernetes.io/name
            operator: In
            values:
            - netperf-server
        topologyKey: kubernetes.io/hostname
  containers:
  - name: netperf
    args:
    - sleep
    - infinity
    image: cilium/netperf
EOF

# egress BW 제한 정보 확인
kubectl describe pod netperf-server | grep Annotations:
Annotations:  kubernetes.io/egress-bandwidth: 10M

# egress BW 제한이 설정된 파드가 있는 cilium pod 에서 제한 정보 확인
c1 bpf bandwidth list
c2 bpf bandwidth list
IDENTITY   EGRESS BANDWIDTH (BitsPerSec)
904        10M

c1 endpoint list
c2 endpoint list
ENDPOINT   POLICY (ingress)   POLICY (egress)   IDENTITY   LABELS (source:key[=value])                 IPv6   IPv4           STATUS
           ENFORCEMENT        ENFORCEMENT
904        Disabled           Disabled          21565      k8s:app.kubernetes.io/name=netperf-server          172.16.2.153   ready

# 트래픽 발생 >> Hubble UI 에서 확인
# egress traffic of the netperf-server Pod has been limited to 10Mbit per second.
NETPERF_SERVER_IP=$(kubectl get pod netperf-server -o jsonpath='{.status.podIP}')
kubectl exec netperf-client -- netperf -t TCP_MAERTS -H "${NETPERF_SERVER_IP}"
Recv   Send    Send
Socket Socket  Message  Elapsed
Size   Size    Size     Time     Throughput
bytes  bytes   bytes    secs.    10^6bits/sec
131072 16384   16384    10.00    9.54  # 10Mbps 제한 확인!

# 5M 제한 설정 후 테스트
kubectl get pod netperf-server -o json | sed -e 's|10M|5M|g' | kubectl apply -f -
c1 bpf bandwidth list
c2 bpf bandwidth list
kubectl exec netperf-client -- netperf -t TCP_MAERTS -H "${NETPERF_SERVER_IP}"
Recv   Send    Send
Socket Socket  Message  Elapsed
Size   Size    Size     Time     Throughput
bytes  bytes   bytes    secs.    10^6bits/sec
131072 16384   16384    10.09    4.56  # 4.5Mbps 제한 확인!

# 20M 제한 설정 후 테스트
kubectl get pod netperf-server -o json | sed -e 's|5M|20M|g' | kubectl apply -f -
kubectl exec netperf-client -- netperf -t TCP_MAERTS -H "${NETPERF_SERVER_IP}"
Recv   Send    Send
Socket Socket  Message  Elapsed
Size   Size    Size     Time     Throughput
bytes  bytes   bytes    secs.    10^6bits/sec
131072 16384   16384    10.00    18.95 # 19Mbps 제한 확인!

tc qdisc show dev ens5

# 삭제
kubectl delete pod netperf-client netperf-server
👉 Step 07. L2 Announcements / L2 Aware LB (Beta)
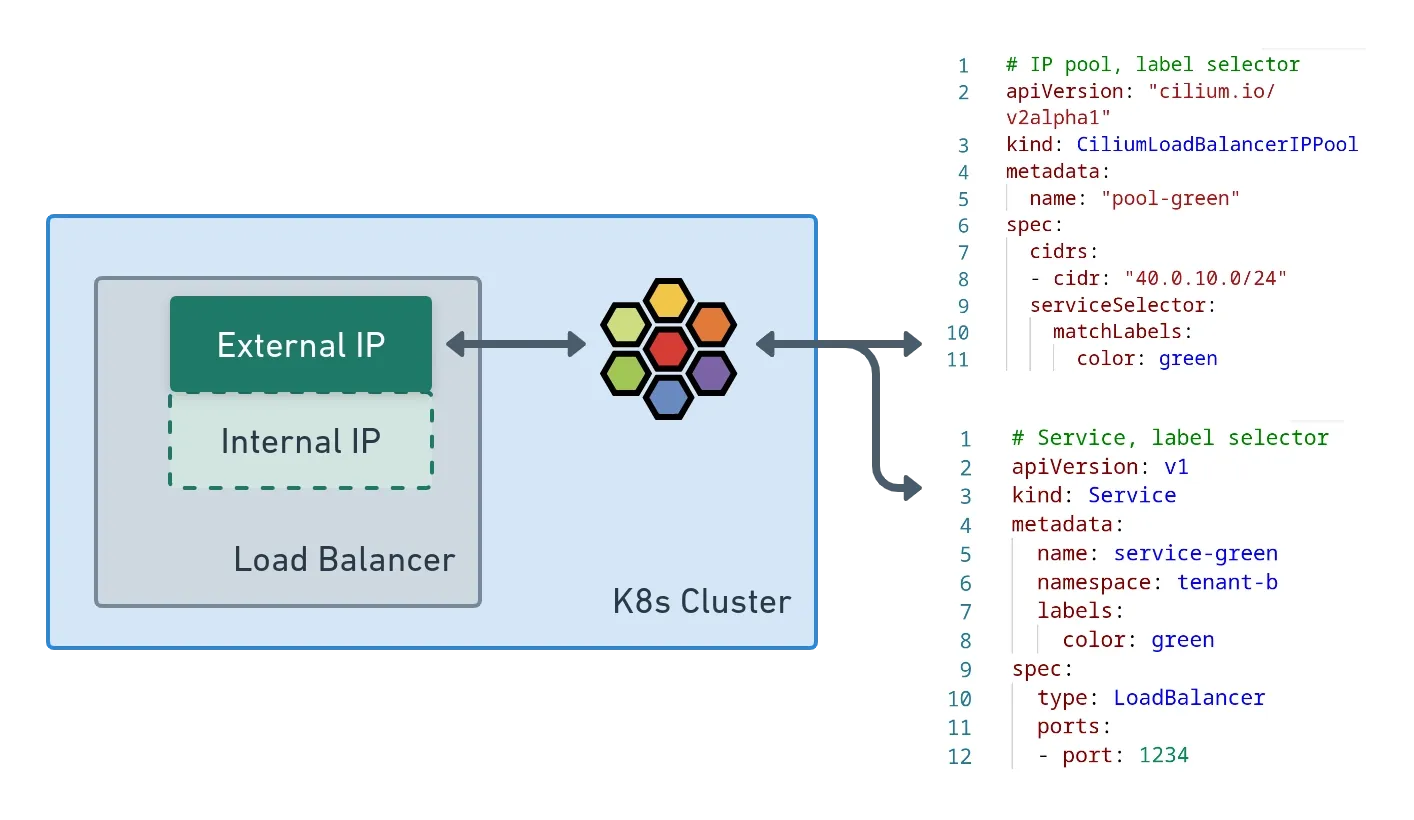
L2 Announcements / L2 Aware LB (Beta) - Link , Blog
- L2 Announcements는 로컬 영역 네트워크에서 서비스를 표시하고 도달 가능하게 만드는 기능입니다. 이 기능은 주로 사무실 또는 캠퍼스 네트워크와 같이 BGP 기반 라우팅이 없는 네트워크 내에서 온프레미스 배포를 위해 고안되었습니다.
- 이 기능을 사용하면 ExternalIP 및/또는 LoadBalancer IP에 대한 ARP 쿼리에 응답합니다. 이러한 IP는 여러 노드의 가상 IP(네트워크 장치에 설치되지 않음)이므로 각 서비스에 대해 한 번에 한 노드가 ARP 쿼리에 응답하고 MAC 주소로 응답합니다. 이 노드는 서비스 로드 밸런싱 기능으로 로드 밸런싱을 수행하여 북쪽/남쪽 로드 밸런서 역할을 합니다.
- NodePort 서비스에 비해 이 기능의 장점은 각 서비스가 고유한 IP를 사용할 수 있으므로 여러 서비스가 동일한 포트 번호를 사용할 수 있다는 것입니다. NodePort를 사용할 때 트래픽을 보낼 호스트를 결정하는 것은 클라이언트에게 달려 있으며 노드가 다운되면 IP+Port 콤보를 사용할 수 없게 됩니다. L2 공지를 사용하면 서비스 VIP가 다른 노드로 간단히 마이그레이션되고 계속 작동합니다.
 https://isovalent.com/blog/post/migrating-from-metallb-to-cilium/
설정 확인
#
helm upgrade cilium cilium/cilium --namespace kube-system --reuse-values \
--set l2announcements.enabled=true --set externalIPs.enabled=true \
--set l2announcements.leaseDuration=3s --set l2announcements.leaseRenewDeadline=1s --set l2announcements.leaseRetryPeriod=200ms

#
c0 config --all  |grep L2
EnableL2Announcements             : true
EnableL2NeighDiscovery            : true

# CiliumL2AnnouncementPolicy 생성
cat <<EOF | kubectl apply -f -
apiVersion: "cilium.io/v2alpha1"
kind: CiliumL2AnnouncementPolicy
metadata:
  name: policy1
spec:
  serviceSelector:
    matchLabels:
      color: blue
  nodeSelector:
    matchExpressions:
      - key: node-role.kubernetes.io/control-plane
        operator: DoesNotExist
  interfaces:
  - ^ens[0-9]+
  externalIPs: true
  loadBalancerIPs: true
EOF

# 확인
kubectl get ciliuml2announcementpolicy
kc describe l2announcement

#
cat <<EOF | kubectl apply -f -
apiVersion: "cilium.io/v2alpha1"
kind: CiliumLoadBalancerIPPool
metadata:
  name: "cilium-pool"
spec:
  allowFirstLastIPs: "No"
  blocks:
  - cidr: "10.10.200.0/29"
EOF

# cilium ip pool 조회
kubectl get CiliumLoadBalancerIPPool
NAME          DISABLED   CONFLICTING   IPS AVAILABLE   AGE
cilium-pool   false      False         3               3m5s
테스트용 파드, 서비스 생성
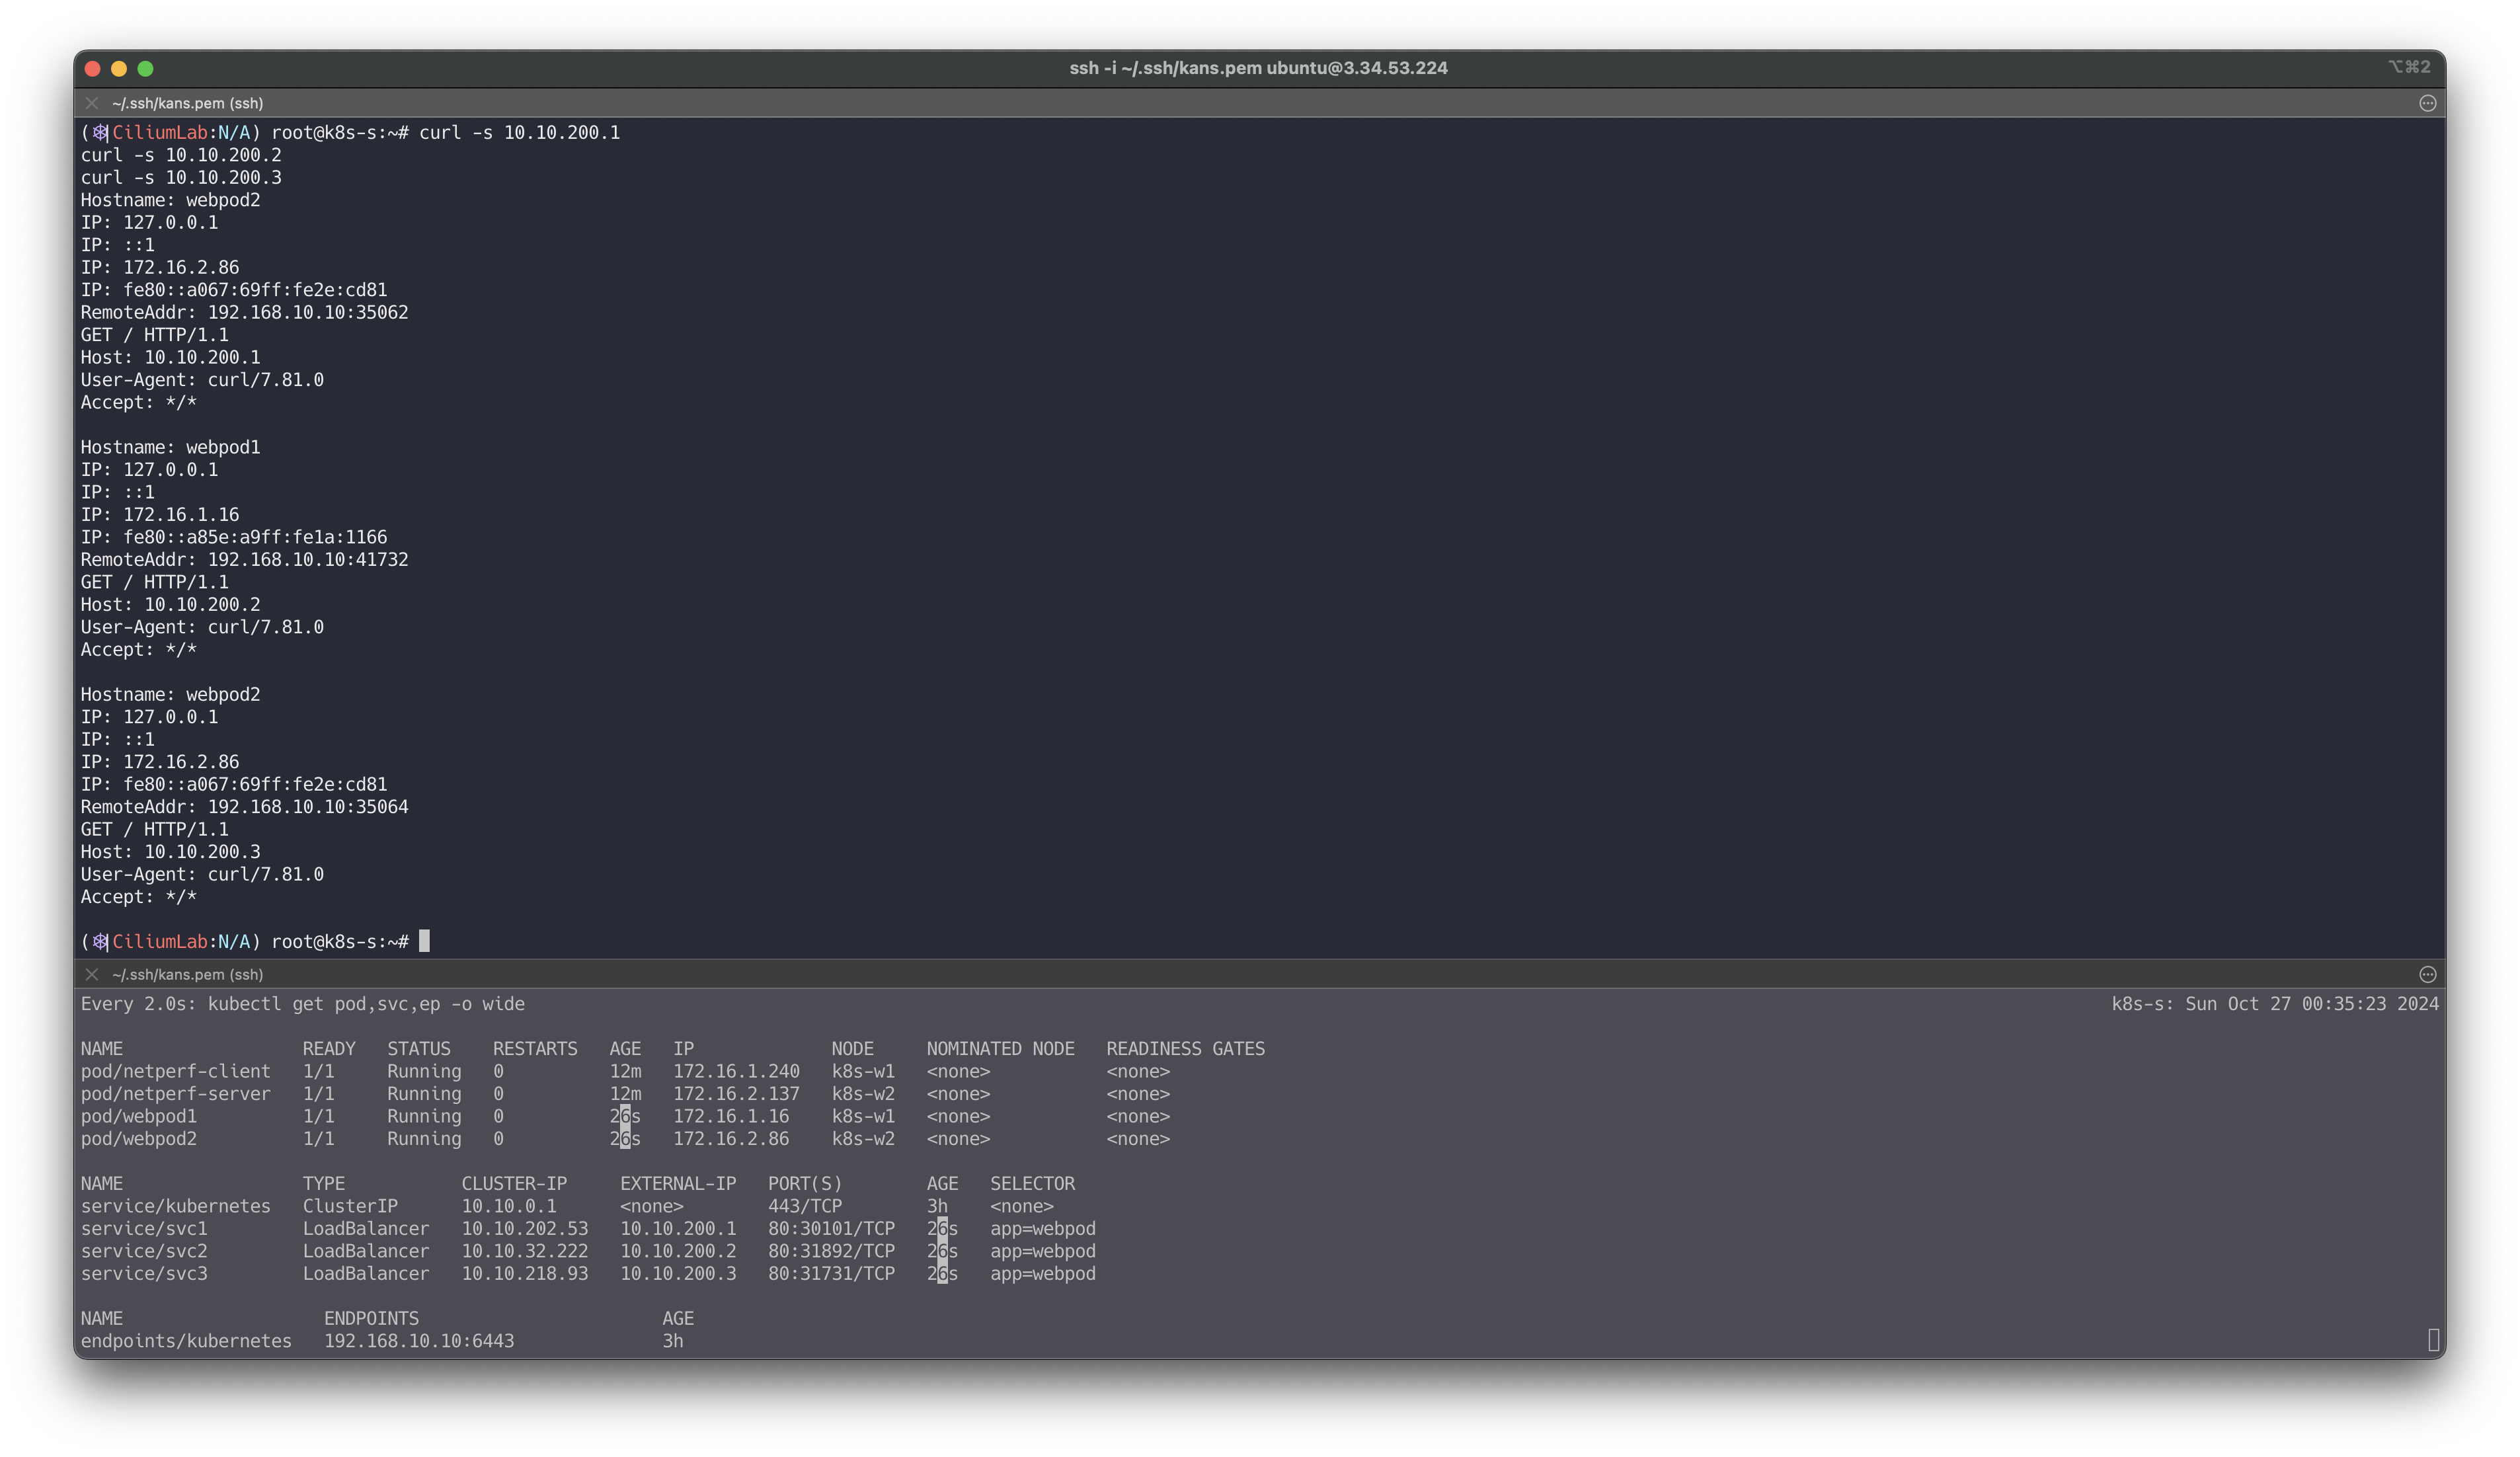
#
cat <<EOF | kubectl apply -f -
apiVersion: v1
kind: Pod
metadata:
  name: webpod1
  labels:
    app: webpod
spec:
  nodeName: k8s-w1
  containers:
  - name: container
    image: traefik/whoami
  terminationGracePeriodSeconds: 0
---
apiVersion: v1
kind: Pod
metadata:
  name: webpod2
  labels:
    app: webpod
spec:
  nodeName: k8s-w2
  containers:
  - name: container
    image: traefik/whoami
  terminationGracePeriodSeconds: 0
---
apiVersion: v1
kind: Service
metadata:
  name: svc1
spec:
  ports:
    - name: svc1-webport
      port: 80
      targetPort: 80
  selector:
    app: webpod
  type: LoadBalancer  # 서비스 타입이 LoadBalancer
---
apiVersion: v1
kind: Service
metadata:
  name: svc2
spec:
  ports:
    - name: svc2-webport
      port: 80
      targetPort: 80
  selector:
    app: webpod
  type: LoadBalancer
---
apiVersion: v1
kind: Service
metadata:
  name: svc3
spec:
  ports:
    - name: svc3-webport
      port: 80
      targetPort: 80
  selector:
    app: webpod
  type: LoadBalancer
EOF
👉 Step 08. Cilium Egress Gateway
Egress Gateway
- Egress Gateway - Link
- Egress Gateway Advanced Troubleshooting - Link
- [카카오] 기존 100여대의 gateway 역할 서버를 k8s cliium egress gateway 를 통해서 40여대의 서버로 줄여서, 서버 비용과 운영 비용 감소 - Blog
Egress IP Gateway 소개*
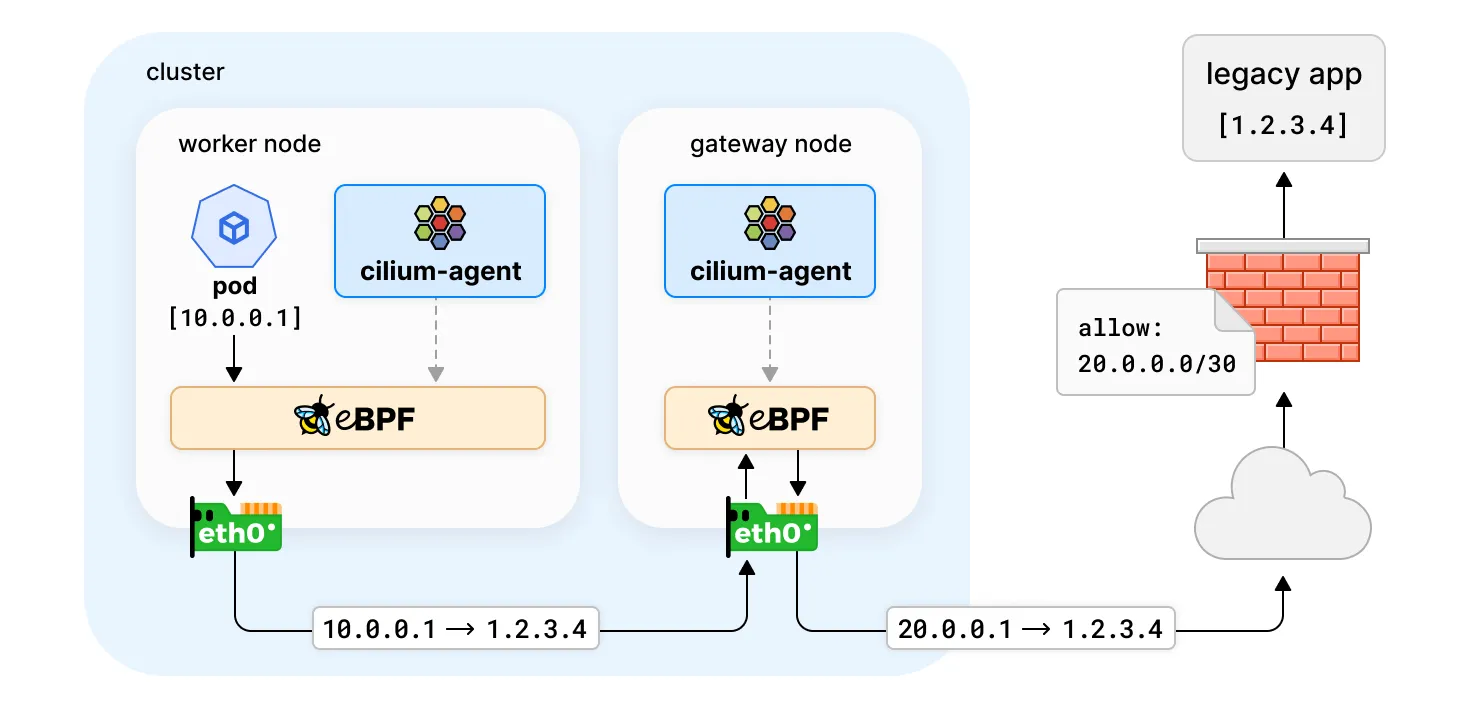
- 특정 파드들을 특정 Egress GW(특정 IP)를 고정으로 외부(혹은 특정 대역)와 통신을 설정할 수 있다
- Egress IP Gateway 를 활성화하고 Egress SNAT 정책 설정
https://isovalent.com/blog/post/2021-12-release-111#egress-gateway-improvements
👉 Step 09. LoadBalancer IP Address Management (LB IPAM)
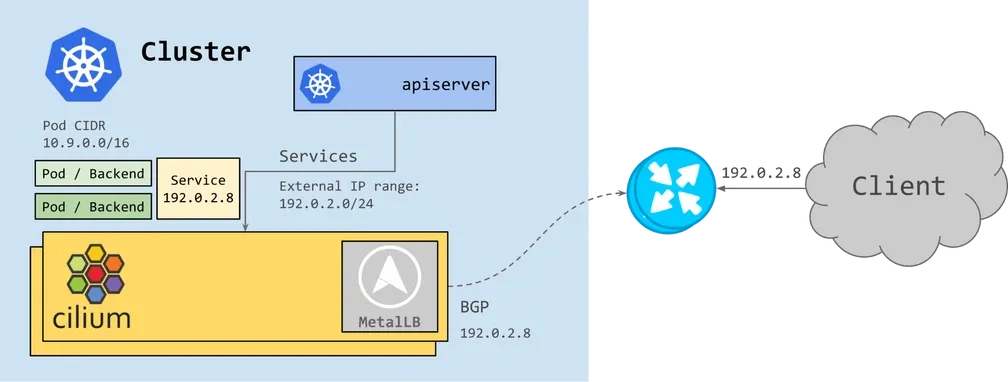
*BGP(MetalLB) for LoadBalancer VIP - 링크*
- Cilium v1.10 부터는 별도의 추가 구성요소 없이, 서비스(Service)의 IP 를 외부에 BGP 로 광고할 수 있습니다 ← MetalLB 가 Cilium 파드에 포함됨
- Now, services are able to be reached externally from traffic outside of the cluster, without any additional components.
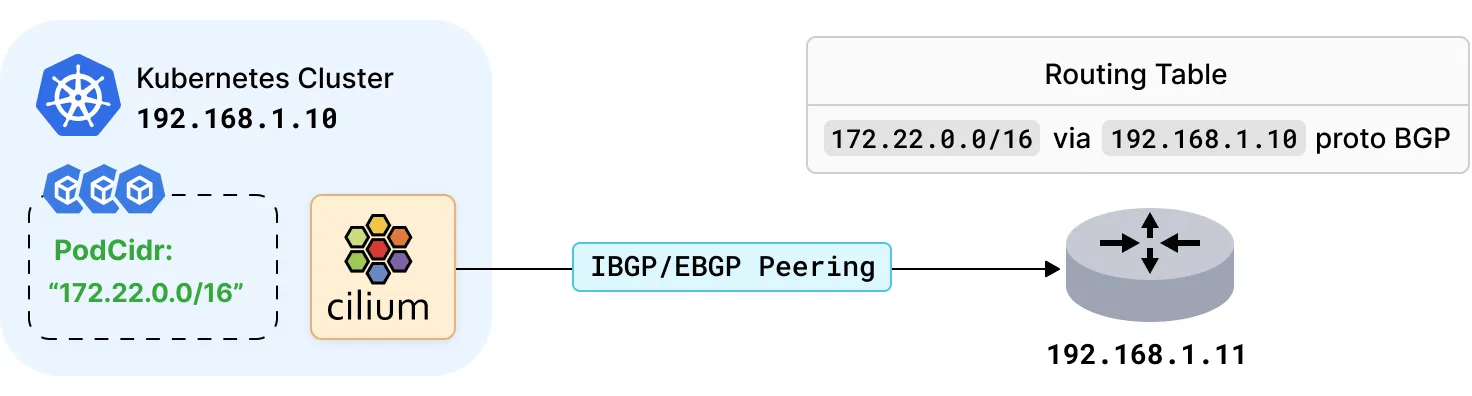
- Cilium v1.11 부터는 파드의 CIDR 를 Egress IP Gateway 를 통해 BGP 로 광고가 가능합니다. - 링크
- BGP Pod CIDR Announcement: Advertise PodCIDR IP routes to your network using BGP.
 https://isovalent.com/blog/post/2021-12-release-111
👉 Step 10. Service Mesh (+Ingress, GatewayAPI)
- Service Mesh 링크
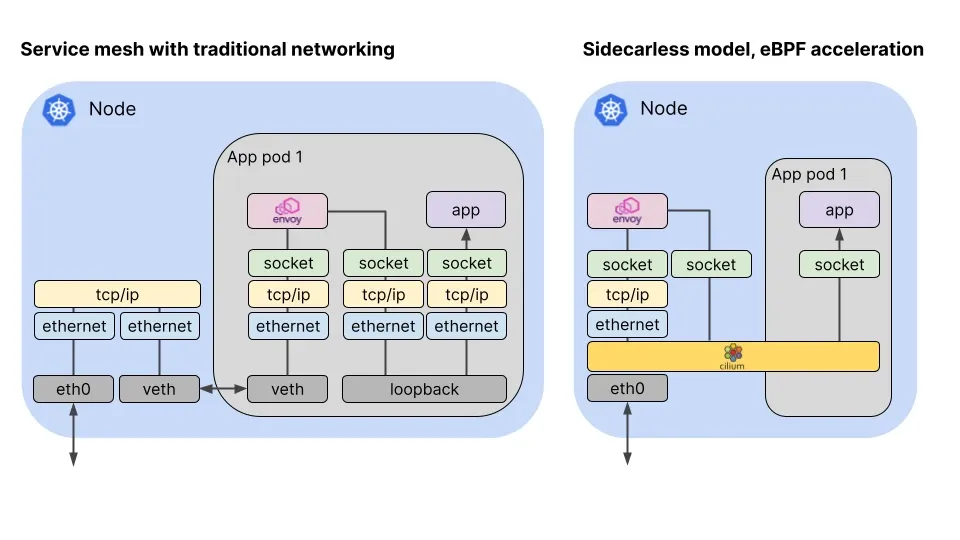
Getting Started Using Istio - 링크 & eBPF-Enabled Network Efficiency - 링크
- Network packets travel through a much shorter path in the eBPF-accelerated, sidecarless proxy model for service mesh
 https://cilium.io/blog/2021/12/01/cilium-service-mesh-beta
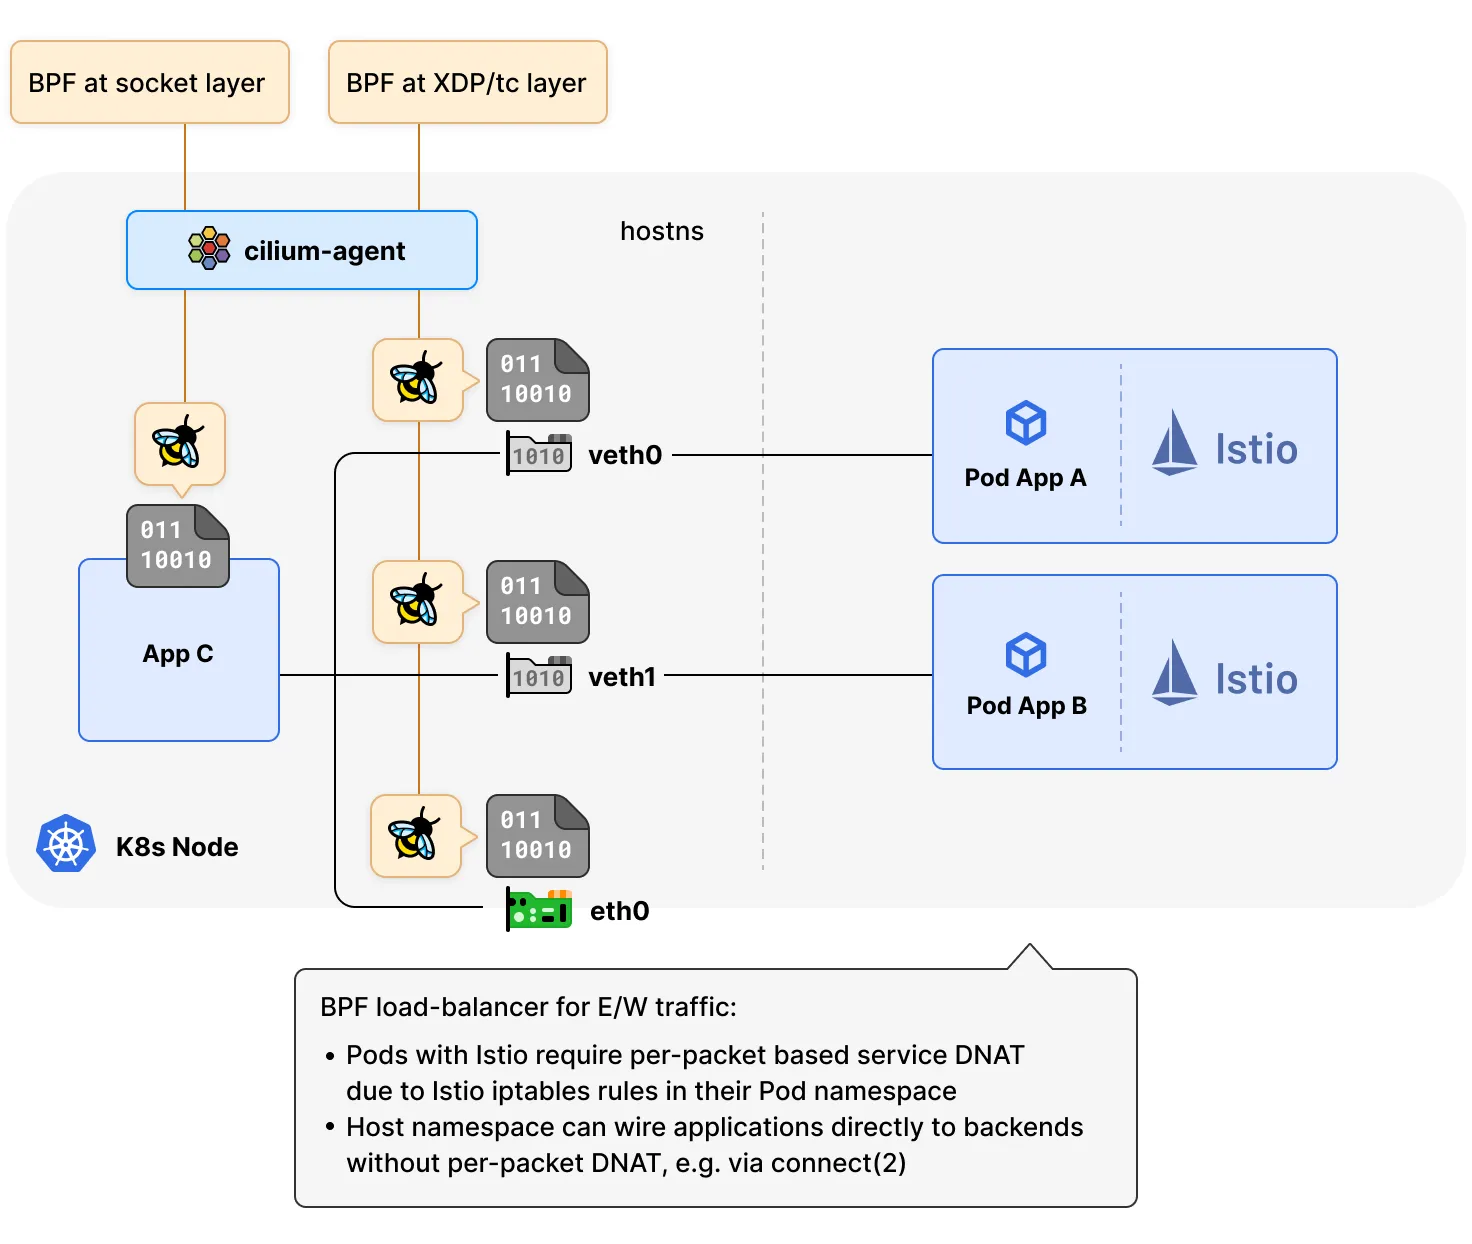
- Istio Support with Kube-Proxy-Replacement
https://isovalent.com/blog/post/2021-12-release-111
📌 Conclusion
이번 Cilium 네트워크 스터디를 통해 eBPF의 강력한 성능과 유연한 네트워크 관리 기능을 이해하게 되었습니다. 특히 Cilium을 활용한 네트워크 성능 최적화와 정책 적용 방식을 탐구하며, 기존 iptables 기반 접근의 한계를 극복할 수 있는 방안을 모색했습니다.
Cilium의 eBPF 기반 데이터 경로 최적화는 네트워크 성능을 크게 향상시킬 수 있음을 확인했으며, Socket-Based LoadBalancing 기능을 통해 서비스 간 트래픽의 라우팅을 효율적으로 관리하는 방법을 실습하였습니다. 또한 Hubble을 활용한 네트워크 관찰성을 통해 실시간으로 네트워크 상태를 파악하고 문제를 해결하는 능력을 배양했습니다.
L3/L4 및 L7 네트워크 정책을 통해 파드 간의 통신을 세밀하게 제어하고, 이를 통해 보안성을 한층 더 강화할 수 있었습니다. 대역폭 관리 기능을 이용해 개별 파드의 대역폭을 제한하고 최적화함으로써 네트워크 자원의 효율적 사용 방안을 실습했습니다.
이번 스터디를 통해 Cilium을 활용한 Kubernetes 네트워킹에 대한 실질적인 지식을 쌓을 수 있었으며, 이를 통해 클라우드 환경에서의 네트워크 관리와 성능 최적화를 적극적으로 활용할 수 있을 것으로 기대합니다.
🔗 Reference
-
Cilium 공식 문서: https://docs.cilium.io/en/stable/
-
eBPF 프로젝트: https://ebpf.io/
-
Hubble 소개: https://cilium.io/blog/2019/11/19/announcing-hubble
-
Kubernetes 네트워크 정책: https://kubernetes.io/docs/concepts/services-networking/network-policies/
-
L7 보안 정책 예시: https://docs.cilium.io/en/stable/security/policy/language/#l7-policy
-
카카오 기술 블로그 - Cilium Egress Gateway: https://tech.kakaopay.com/post/cilium-egress-gateway/
-
Prometheus & Grafana 통합 모니터링: https://docs.cilium.io/en/stable/observability/grafana/