Review: What purpose does a large sample serve?
With independent observations and not extremely skewed population distribution, a large sample would ensure…
- A nearly normal sampling distribution of the mean
- A better s estimate for the population SD, sigma
- A reliable estimate of the Standard Error (s / route(n))
• Standard Error is the standard deviation of the sampling distribution of a statistic.
• The uncertainty of Standard Error estimate is addressed by using the T-distribution
T - distribution (1)
- Used for inference on a mean where sigma is unknown. (almost always)
- To address the uncertainty of the Standard Error estimate
- Unimodal, symmetric
- Bell shaped but thicker tails than the normal distribution
• As s (sample standard deviation) is used instead of sigma (population standard deviation)
Normal distribution vs T – distribution
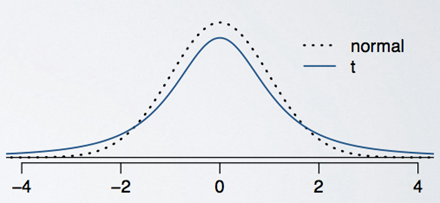
- Peek of the t-distribution is lower than that of the normal distribution, but has thicker tails
- Observations are more likely to fall beyond two standard deviations from the mean than under the normal distribution.
- Confidence intervals constructed using the t distribution will be wider, more conservative than those constructed with the normal distribution.
- Thicker tails are helpful for mitigating the effect of a less reliable estimate for the standard error of the sampling distribution
T-distribution over Standard Normal Distribution
-
Population Standard Deviation (σ) is Unknown
- If σ is unknown, you must estimate it using the sample standard deviation (s). This introduces additional uncertainty, which the t-distribution accounts for.
-
Small Sample Size(n<30)
- For small sample sizes (𝑛<30), the variability in the sampling distribution is greater, and the t-distribution's heavier tails adjust for this increased uncertainty.
- The Z-distribution assumes the sample size is large enough for the Central Limit Theorem to smooth out these variations.
-
Heavier Tails in the t-Distribution
- The t-distribution has heavier tails compared to the Z-distribution. This means it is more likely to account for extreme values or outliers, which are more impactful in small samples.
T - distribution (2)
- Always centered at 0 (like the standard normal)
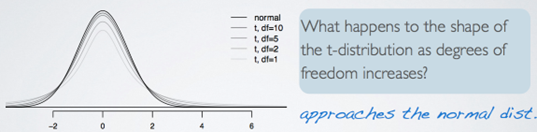
- Has one parameter: degrees of freedom(df) which determines the thickness of tails
(the normal distribution has two parameters: mean and SD) - As the degrees of freedom increases, it aproaches normal distribution.
- Degrees of freedom is tied to sample size
T Score for a Hypothesis Test
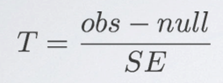
(Example)
Effect of degrees of freedom in t-distribution, significance level = 0.05
- P(|Z| > 2) = 0.0455 - reject
- P(|t df = 50| > 2) = 0.0509 – fail to reject ?
- P(|t df = 10| > 2) = 0.0734 – fail to reject
• More conservative with a t distribution with lower degrees of freedom, less likely to be able to reject the null hypothesis.
• Not as easy to reject the null hypothesis with a small sample size and stronger evidence is needed in order to be able to do so.
텍스트