[Hypothesis Testing]
- Null hypothesis : Often either a skeptical perspective or a claim to be tested.
- Alternative Hypothesis : Represents an alternative claim under consideration and is often represented by a range of possible parameter values.
1. Hypothesis testing via Confidence Interval
The distribution of sample statistics is nearly normal, centered at the population mean, and with the standard error.
- A quick and dirty approach for hypothesis testing.
- Doesn't tell us the likelihood of certain outcomes under the null hypothesis; the p-value, based on which we can make decisions on the hypothesis.
(Example)
You have constructed a 95% confidence interval for the average number of exclusive relationships college students have been to be (2.7, 3.7). Based on this confidence interval, do these data support the hypothesis that college students on average have been in more than 3 exclusive relationships.
- H0: μ = 3
- H1: μ > 3
Since 3 falls in the interval, you fail to reject the null hypothesis that states college students have been in 3 exclusive relationships, on average.
• The interval says that any value within it could conceivably be the true population mean.
2. Formal hypothesis testing using p-value
P-value
P(observed or more extreme outcome l H0 is true): the probability of observing data at least as favorable to the alternative hypothesis as our current data set, if the null hypothesis was true.
Interpreting P-value
1. p-value < alpha: it would be very unlikely to observe the data if the null hypothesis were true, and therefore we reject the null hypothesis.
- p-value > alpha: it is indeed likely to observe the data even if the null hypothesis were true. And hence, we would not reject the null hypothesis.
- Since p-value is high enough, you think the high sample mean or an even more extreme sample mean (which is higher than what null hypothesis states) is likely to happen simply by chance. In other words, the difference between the null value and the observed sample mean is due to chance or sampling variability.
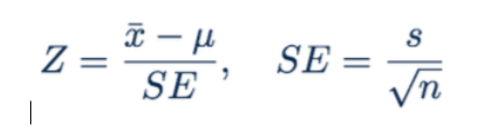
Z score (test statistic)
(Example)
n = 50, x_bar = 3.2, s = 1.74, SE = 0.246
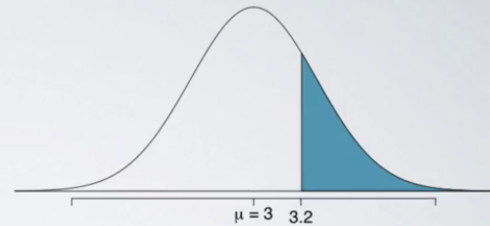
P(x_bar > 3.2 | H0: μ = 3)
X_bar ~ N(μ = 3, SE = 0.246)Since we are assuming null hypothesis to be true, we can use that to construct the sampling distribution based on the central limit theorem.
★ Calculate the z-score (so called ‘test statistic’): z = (3.2-3) / 0.246 = 0.81
★ Find P-value with the z-score = P(z > 0.81) = 0.209Even though we observed a sample mean slightly above 3, there is not enough evidence to reject the null hypothesis that sets the population average of number of exclusive relationships college students have been in to 3. If in fact college students have been in 3 exclusive relationships on average, there is a 21% chance that a random sample of 50 college students would yield a sample mean of 3.2 or higher. This is a pretty high probability, so we think that a sample mean of 3.2 or more exclusive relationships is likely to happen simply by chance. In other words, the difference between the null value of 3 relationships and the observed sample mean of 3.2 relationships is due to chance or sampling variability.
Two-sided hypothesis tests
Often, instead of looking for a divergence from the null hypothesis in a specific direction, so either a greater than or less than sign, we might be interested in divergence in any direction.
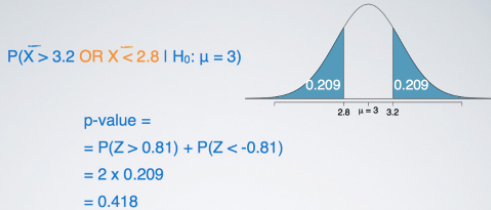
The p-value calculation becomes slightly different and ever so slightly more complicated since we need to consider at least as extreme as the observed outcome in both directions away from the mean.
If you're looking for the cutoff values for these two-sided hypothesis tests, all you need to do is to travel the same distance away from the mean.
Hypothesis testing for a single mean:
- Set the hypothesis
- Calculate the point estimate using a sample
- Check conditions (same as CI condition)
- Draw sampling distribution, calculate test statistic (z score), shade p-value
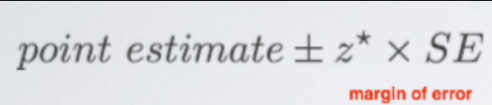
- Make a decision based on [p-value vs alpha(significance level)] and interpret it in context of the research question:
• See 2_3_HT_examples.pdf
Inference for other estimators
Nearly normal sampling distributions
- Sample means
- Difference between sample means (difference between two groups/populations)
- Sample proportion
- Difference between sample proportions (difference between two groups/populations)
Unbiased estimator
An important assumption about point estimates is that they are unbiased, i.e. the sampling distribution of the estimate is centered at the true population parameter it estimates. That is, an unbiased estimate does not naturally over or underestimate the parameter, it provides a ‘good’ estimate. The sample mean is an example of an unbiased point estimate, as well as others we just listed above.
• The way to do inference with both confidence intervals and hypothesis testing is the same for all nearly normal point estimates.