분류(Classification), 피벗 예제
# 분류(Classification), 피벗(pivot) 테이블
import pandas as pd
from sklearn.model_selection import train_test_split, StratifiedKFold
from sklearn.ensemble import RandomForestClassifier
from sklearn.metrics import accuracy_score
df = pd.DataFrame({
'cust_id': [1,1,2,2,2,3,3,4,4,5,5,5,6,6,7,7,7,8,8,9,9,10,10],
'product': ['A','B','A','B','C','A','C','A','B','A','B','C','A','B','A','B','C','A','C','B','C','A','B'],
'buy_cnt': [1,2,3,1,1,2,1,1,2,2,1,3,1,1,4,2,1,3,1,2,1,1,2],
# churn 비율 0:1 = 7:3 (실무형 분포)
'churn': [0,0,1,1,1,0,0,0,0,1,1,1,0,0,0,0,0,1,1,0,0,1,1]
})
pivot = df.pivot_table(
values='buy_cnt', #값으로 입력될 열 입니다.
index='cust_id', #인덱스로 사용될 열입니다.
columns='product', #열로 사용될 열 입니다.
aggfunc='sum', #결과로 출력될 함수 입니다.
fill_value=0 #결측치를 채워넣을 값입니다.
).reset_index()
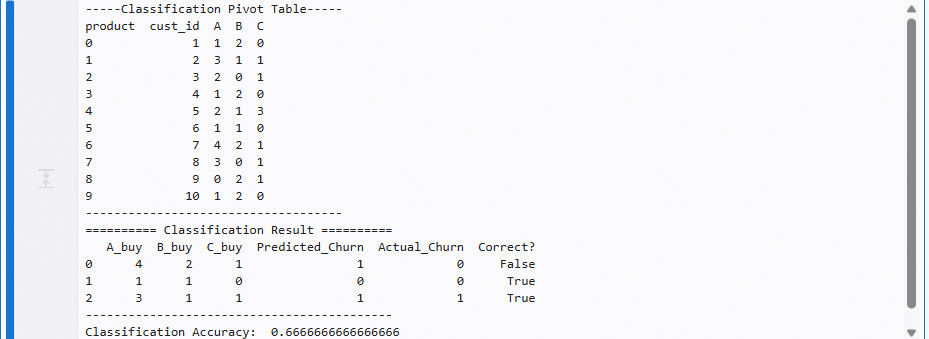
print("-----Classification Pivot Table-----")
print(pivot)
print("------------------------------------")
'''
pivot 테이블에는 **구매 정보(A,B,C)**만 있고,
**정답 라벨(churn)**이 없어서 y값을 붙이기 위해 merge를 한다.
- X(입력): A, B, C 구매량
- y(정답): churn
'''
pivot = pivot.merge(df[['cust_id', 'churn']].drop_duplicates(), on='cust_id')
X = pivot[['A','B','C']]
y = pivot['churn']
X_train, X_test, y_train, y_test = train_test_split(
X, y,
test_size=0.25,
random_state=42,
stratify=y
)
model = RandomForestClassifier(random_state=42)
model.fit(X_train, y_train)
pred = model.predict(X_test)
results = pd.DataFrame({
'A_buy': X_test['A'].values,
'B_buy': X_test['B'].values,
'C_buy': X_test['C'].values,
'Predicted_Churn': pred,
'Actual_Churn': y_test.values,
'Correct?': pred == y_test.values
})
print("========== Classification Result ==========")
print(results)
print("-------------------------------------------")
print("Classification Accuracy: ", accuracy_score(y_test, pred))
-----Classification Pivot Table-----
product  cust_id  A  B  C
0              1  1  2  0
1              2  3  1  1
2              3  2  0  1
3              4  1  2  0
4              5  2  1  3
5              6  1  1  0
6              7  4  2  1
7              8  3  0  1
8              9  0  2  1
9             10  1  2  0
------------------------------------
========== Classification Result ==========
   A_buy  B_buy  C_buy  Predicted_Churn  Actual_Churn  Correct?
0      4      2      1                1             0     False
1      1      1      0                0             0      True
2      3      1      1                1             1      True
-------------------------------------------
Classification Accuracy:  0.6666666666666666
회귀(Regression), 피벗(pivot) 테이블
#회귀(Regression), 피벗(pivot) 테이블
from sklearn.model_selection import train_test_split
from sklearn.ensemble import RandomForestRegressor
from sklearn.metrics import mean_absolute_error
df = pd.DataFrame({
'date': ['2024-01-01','2024-01-01','2024-01-01','2024-01-02','2024-01-02'],
'region': ['A','B','C','A','C'],
'sales': [100,120,90,130,95],
'target_total': [310,310,310,225,225]
})
pivot = df.pivot_table(
values='sales',
index='date',
columns='region',
aggfunc='sum',
fill_value=0
).reset_index()
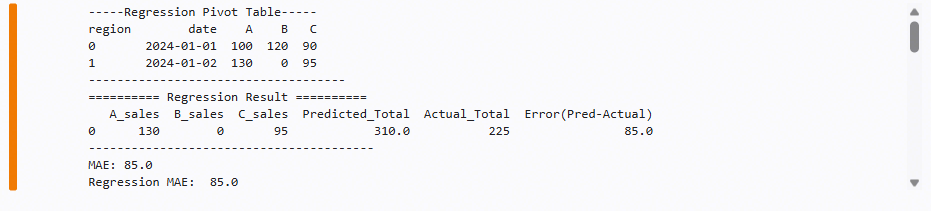
print("-----Regression Pivot Table-----")
print(pivot)
print("------------------------------------")
pivot = pivot.merge(df[['date','target_total']].drop_duplicates(), on='date')
X = pivot[['A','B','C']]
y = pivot['target_total']
X_train, X_test, y_train, y_test = train_test_split(
X, y,
test_size=0.3,
random_state=42
)
model = RandomForestRegressor(random_state=42)
model.fit(X_train, y_train)
pred = model.predict(X_test)
results = pd.DataFrame({
'A_sales': X_test['A'].values,
'B_sales': X_test['B'].values,
'C_sales': X_test['C'].values,
'Predicted_Total': pred,
'Actual_Total': y_test.values,
'Error(Pred-Actual)': pred - y_test.values
})
print("========== Regression Result ==========")
print(results)
print("----------------------------------------")
print("Regression MAE: ", mean_absolute_error(y_test, pred))
-----Regression Pivot Table-----
region        date    A    B   C
0       2024-01-01  100  120  90
1       2024-01-02  130    0  95
------------------------------------
========== Regression Result ==========
   A_sales  B_sales  C_sales  Predicted_Total  Actual_Total  Error(Pred-Actual)
0      130        0       95            310.0           225                85.0
----------------------------------------
Regression MAE:  85.0
시계열(Time Series), 15분 resample
# 시계열(Time Series), 15분 resample
import pandas as pd
from sklearn.ensemble import RandomForestRegressor
from sklearn.metrics import mean_absolute_error
import numpy as np
rng = pd.date_range('2024-01-01 00:00', periods=240, freq='1min')
df = pd.DataFrame({
'timestamp': rng,
'value': (50 + 10*np.sin(range(240)))
})
df.set_index('timestamp', inplace=True)
# 15분 단위 pivot(resample)
df_15 = df.resample('15min').mean().reset_index()
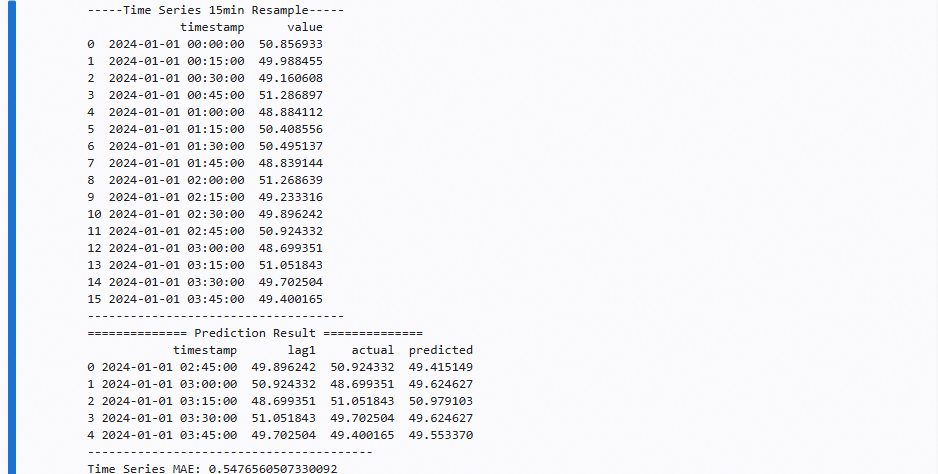
print("-----Time Series 15min Resample-----")
print(df_15)
print("------------------------------------")
# Lag 추가: 한 시점 전(value)을 예측용 특징(feature)으로 사용하기 위함
df_15['lag1'] = df_15['value'].shift(1) # 현재 행의 '직전 15분 값'을 lag1 컬럼으로 생성
df_15 = df_15.dropna() # shift로 인해 첫 행에 생긴 NaN 제거
X = df_15[['lag1']] # 입력값(feature): lag1만 사용
y = df_15['value'] # 예측 대상(target): 현재 value
train_size = int(len(df_15)*0.7) # 전체의 70%를 학습(train), 30%를 테스트(test)로 분리
X_train, X_test = X.iloc[:train_size], X.iloc[train_size:] # 시간 순서를 유지한 채 앞부분은 train, 뒷부분은 test
y_train, y_test = y.iloc[:train_size], y.iloc[train_size:] # 예측해야 하는 값도 동일한 방식으로 분리
model = RandomForestRegressor()
model.fit(X_train, y_train)
pred = model.predict(X_test)
results = pd.DataFrame({
'timestamp': df_15['timestamp'].iloc[train_size:].values,
'lag1': X_test['lag1'].values,
'actual': y_test.values,
'predicted': pred
})
print("============== Prediction Result ==============")
print(results)
print("----------------------------------------")
print("Time Series MAE:", mean_absolute_error(y_test, pred))
-----Time Series 15min Resample-----
             timestamp      value
0  2024-01-01 00:00:00  50.856933
1  2024-01-01 00:15:00  49.988455
2  2024-01-01 00:30:00  49.160608
3  2024-01-01 00:45:00  51.286897
4  2024-01-01 01:00:00  48.884112
5  2024-01-01 01:15:00  50.408556
6  2024-01-01 01:30:00  50.495137
7  2024-01-01 01:45:00  48.839144
8  2024-01-01 02:00:00  51.268639
9  2024-01-01 02:15:00  49.233316
10 2024-01-01 02:30:00  49.896242
11 2024-01-01 02:45:00  50.924332
12 2024-01-01 03:00:00  48.699351
13 2024-01-01 03:15:00  51.051843
14 2024-01-01 03:30:00  49.702504
15 2024-01-01 03:45:00  49.400165
------------------------------------
============== Prediction Result ==============
            timestamp       lag1     actual  predicted
0 2024-01-01 02:45:00  49.896242  50.924332  49.415149
1 2024-01-01 03:00:00  50.924332  48.699351  49.624627
2 2024-01-01 03:15:00  48.699351  51.051843  50.979103
3 2024-01-01 03:30:00  51.051843  49.702504  49.624627
4 2024-01-01 03:45:00  49.702504  49.400165  49.553370
----------------------------------------
Time Series MAE: 0.5476560507330092

Hi!