이번에는 kaggle의 신용카드 데이터 세트를 이용해 신용카드 사기 검출 분류 실습을 수행해보자.
이 데이터 세트의 class는 0, 1로 분류되는데 0은 정상적인 신용카드 트랜잭션 데이터, 1은 사기 트랜잭션이다. 전체 데이터의 0.172%만이 사기 트랜잭션으로 매우 불균형한 분포를 가지고 있다.
언더 샘플링과 오버 샘플링

Source: https://ichi.pro/ko/bulgyunhyeong-deiteo-yeongu-28681653753326
이런 경우 대부분 정상 레이블 쪽으로 예측하면서 제대로된 예측이 힘든데 이때 오버 샘플링(Oversampling) 과 언더 샘플링(Undersampling) 방법을 사용하며, 일반적으로 오버 샘플링이 예측 성능상 더 유리한 경우가 많아 주로 사용된다.
- 언더 샘플링: 많은 데이터 세트를 적은 데이터 세트 수준으로 감소시키는 방식이다. 이렇게 학습을 수행하면 과도하게 정상 레이블로 학습/예측하는 부작용을 개선할 수 있지만, 너무 많은 정상 레이블 데이터를 감소시켜 정상 레이블의 경우 오히려 제대로 된 학습을 할 수 없다는 단점이 있어 잘 적용하지 않는다.
- 오버 샘플링: 이상 데이터와 같은 적은 데이터 세트를 증식하여 학습을 위한 충분한 데이터를 확보하는 방법이다. 동일한 데이터를 단순히 증식하면 과적합이 되기에 원본 데이터의 피처 값들을 아주 약간만 변경하여 증식한다. 대표적으로 SMOTE(Synthetic Minority Over-sampling Technique) 방법이 있는데, 이는 적은 데이터 세트에 있는 개별 데이터들의 K Nearest Neighbor 를 찾아서 이 데이터와 K개 이웃들의 차이를 일정 값으로 만들어 기존 데이터와 약간 차이가 나는 새로운 데이터를 생성하는 방식이다.

데이터 일차 가공 및 모델 학습/예측/평가
import numpy as np
import pandas as pd
import matplotlib.pyplot as plt
import warnings
warnings.filterwarnings('ignore')
%matplotlib inline
card_df = pd.read_csv('creditcard.csv')
card_df.head(3)| Time | V1 | V2 | V3 | V4 | V5 | V6 | V7 | V8 | V9 | ... | V21 | V22 | V23 | V24 | V25 | V26 | V27 | V28 | Amount | Class | |
|---|---|---|---|---|---|---|---|---|---|---|---|---|---|---|---|---|---|---|---|---|---|
| 0 | 0.0 | -1.359807 | -0.072781 | 2.536347 | 1.378155 | -0.338321 | 0.462388 | 0.239599 | 0.098698 | 0.363787 | ... | -0.018307 | 0.277838 | -0.110474 | 0.066928 | 0.128539 | -0.189115 | 0.133558 | -0.021053 | 149.62 | 0 |
| 1 | 0.0 | 1.191857 | 0.266151 | 0.166480 | 0.448154 | 0.060018 | -0.082361 | -0.078803 | 0.085102 | -0.255425 | ... | -0.225775 | -0.638672 | 0.101288 | -0.339846 | 0.167170 | 0.125895 | -0.008983 | 0.014724 | 2.69 | 0 |
| 2 | 1.0 | -1.358354 | -1.340163 | 1.773209 | 0.379780 | -0.503198 | 1.800499 | 0.791461 | 0.247676 | -1.514654 | ... | 0.247998 | 0.771679 | 0.909412 | -0.689281 | -0.327642 | -0.139097 | -0.055353 | -0.059752 | 378.66 | 0 |
3 rows × 31 columns
- Time 은 데이터 생성 관련한 작업용 속성으로 제거한다.
- V1~V28 은 kaggle 데이터 설명에서 사용자 ID 및 중요한 기능을 보호하기 위한 PCA 차원 감소의 결과 라고 되어있다. 즉, 피처의 의미를 알 수 없다.
- Amount 는 신용카드 트랜잭션의 금액을 의미한다.
- Class 는 0이면 정상, 1이면 사기 트랜잭션이다.
card_df.info()<class 'pandas.core.frame.DataFrame'>
RangeIndex: 284807 entries, 0 to 284806
Data columns (total 31 columns):
Time 284807 non-null float64
V1 284807 non-null float64
V2 284807 non-null float64
V3 284807 non-null float64
V4 284807 non-null float64
V5 284807 non-null float64
V6 284807 non-null float64
V7 284807 non-null float64
V8 284807 non-null float64
V9 284807 non-null float64
V10 284807 non-null float64
V11 284807 non-null float64
V12 284807 non-null float64
V13 284807 non-null float64
V14 284807 non-null float64
V15 284807 non-null float64
V16 284807 non-null float64
V17 284807 non-null float64
V18 284807 non-null float64
V19 284807 non-null float64
V20 284807 non-null float64
V21 284807 non-null float64
V22 284807 non-null float64
V23 284807 non-null float64
V24 284807 non-null float64
V25 284807 non-null float64
V26 284807 non-null float64
V27 284807 non-null float64
V28 284807 non-null float64
Amount 284807 non-null float64
Class 284807 non-null int64
dtypes: float64(30), int64(1)
memory usage: 67.4 MBNull 값은 존재하지 않으며, Class 를 제외한 모든 피처는 float64형이다.
from sklearn.model_selection import train_test_split

# 인자로 입력받은 DataFrame을 복사한 뒤 Time 칼럼만 삭제하고 복사된 DataFrame을 반환하는 함수
def get_preprocessed_df(df=None):
    df_copy = df.copy()
    df_copy.drop('Time', axis=1, inplace=True)
    return df_copy
# 사전 데이터 가공 후 학습과 테스트 데이터 세트를 반환하는 함수
def get_train_test_dataset(df=None):
df_copy = get_preprocessed_df(df)
# DataFrame의 맨 마지막 칼럼이 레이블, 나머지는 피처들
X_features = df_copy.iloc[:, :-1]
y_target = df_copy.iloc[:, -1]
# stratify = y_target 으로 stratified 기반 분할
X_train, X_test, y_train, y_test = train_test_split(X_features, y_target, test_size=0.3, random_state=0, stratify=y_target)
return X_train, X_test, y_train, y_test
X_train, X_test, y_train, y_test = get_train_test_dataset(card_df)print('학습 데이터 레이블 값 비율')
print(y_train.value_counts()/y_train.shape[0] * 100)
print('테스트 데이터 레이블 값 비율')
print(y_test.value_counts()/y_test.shape[0] * 100)학습 데이터 레이블 값 비율
0 99.827451
1 0.172549
Name: Class, dtype: float64
테스트 데이터 레이블 값 비율
0 99.826785
1 0.173215
Name: Class, dtype: float64from sklearn.metrics import confusion_matrix, accuracy_score, precision_score, recall_score, f1_score, roc_auc_score
def get_clf_eval(y_test, pred=None, pred_proba=None):
confusion = confusion_matrix(y_test, pred)
accuracy = accuracy_score(y_test, pred)
precision = precision_score(y_test, pred)
recall = recall_score(y_test, pred)
f1 = f1_score(y_test, pred)
roc_auc = roc_auc_score(y_test, pred)
print('오차행렬')
print(confusion)
print('정확도: {0:.4f}, 정밀도: {1:.4f}, 재현율: {2:.4f}, F1: {3:.4f}, AUC:{4:.4f}'
.format(accuracy, precision, recall, f1, roc_auc))from sklearn.linear_model import LogisticRegression
lr_clf = LogisticRegression()
lr_clf.fit(X_train, y_train)
lr_pred = lr_clf.predict(X_test)
lr_pred_proba = lr_clf.predict_proba(X_test)[:, 1]
get_clf_eval(y_test, lr_pred, lr_pred_proba)오차행렬
[[85269 26]
[ 58 90]]
정확도: 0.9990, 정밀도: 0.7759, 재현율: 0.6081, F1: 0.6818, AUC:0.8039재현율이 0.6081, ROC-AUC가 0.8039 이다.
이번엔 LightGBM 을 이용한 모델을 만들건데, 반복적으로 모델을 변경해 학습/예측/평가할 것이므로 함수를 생성하자.
def get_model_train_eval(model, ftr_train=None, ftr_test=None, tgt_train=None, tgt_test=None):
    model.fit(ftr_train, tgt_train)
    pred = model.predict(ftr_test)
    pred_proba = model.predict_proba(ftr_test)[:, 1]
    get_clf_eval(tgt_test, pred, pred_proba)
# 불균형한 레이블 값 분포도를 가지므로 LGBMClassifier에서 boost_from_average=False로 설정해야한다.
from lightgbm import LGBMClassifier
lgbm_clf = LGBMClassifier(n_estimators=1000, num_leaves=64, n_jobs=-1, boost_from_average=False)
get_model_train_eval(lgbm_clf, ftr_train=X_train, ftr_test=X_test, tgt_train=y_train, tgt_test=y_test)오차행렬
[[85290 5]
[ 36 112]]
정확도: 0.9995, 정밀도: 0.9573, 재현율: 0.7568, F1: 0.8453, AUC:0.8783재현율이 0.7568, ROC-AUC가 0.8793 으로 로지스틱 회귀보다 높은 수치를 나타낸다.
데이터 분포도 변환 후 모델 학습/예측/평가
import seaborn as sns

plt.figure(figsize=(8, 4))
plt.xticks(range(0, 30000, 1000), rotation=60)
sns.distplot(card_df['Amount'])
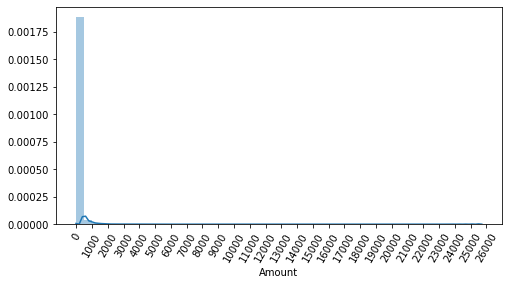
1,000불 이하의 데이터가 대부분이며, 26,000불까지 꼬리가 긴 형태의 분포 곡선을 가지고 있다.
from sklearn.preprocessing import StandardScaler
# 사이킷런의 StandardScaler를 이용해 정규 분포 형태로 Amount 피처 값 변환하는 로직으로 수정
def get_preprocessed_df(df=None):
    df_copy = df.copy()
    scaler = StandardScaler()
    amount_n = scaler.fit_transform(df_copy['Amount'].values.reshape(-1, 1))
    df_copy.insert(0, 'Amount_Scaled', amount_n)
    # 기존 Time, Amount 피처 삭제
    df_copy.drop(['Time', 'Amount'], axis=1, inplace=True)
return df_copyX_train, X_test, y_train, y_test = get_train_test_dataset(card_df)
print('### 로지스틱 회귀 예측 성능 ###')
lr_clf = LogisticRegression()
get_model_train_eval(lr_clf, ftr_train=X_train, ftr_test=X_test, tgt_train=y_train, tgt_test=y_test)
print('\n### LightGBM 예측 성능 ###')
lgbm_clf = LGBMClassifier(n_estimators=1000, num_leaves=64, n_jobs=-1, boost_from_average=False)
get_model_train_eval(lgbm_clf, ftr_train=X_train, ftr_test=X_test, tgt_train=y_train, tgt_test=y_test)### 로지스틱 회귀 예측 성능 ###
오차행렬
[[85281 14]
[ 58 90]]
정확도: 0.9992, 정밀도: 0.8654, 재현율: 0.6081, F1: 0.7143, AUC:0.8040
### LightGBM 예측 성능 ###
오차행렬
[[85290 5]
[ 37 111]]
정확도: 0.9995, 정밀도: 0.9569, 재현율: 0.7500, F1: 0.8409, AUC:0.8750이전 로지스틱 회귀 예측 성능: 정확도: 0.9990, 정밀도: 0.7759, 재현율: 0.6081, F1: 0.6818, AUC:0.8039
현재 로지스틱 회귀 예측 성능: 정확도: 0.9992, 정밀도: 0.8654, 재현율: 0.6081, F1: 0.7143, AUC:0.8040
이전 LightGBM 예측 성능: 정확도: 0.9995, 정밀도: 0.9573, 재현율: 0.7568, F1: 0.8453, AUC:0.8783
현재 LightGBM 예측 성능: 정확도: 0.9995, 정밀도: 0.9569, 재현율: 0.7500, F1: 0.8409, AUC:0.8750
정규 분포 형태로 Amount 피처값을 변환한 후 적용한 두 모델 모두 이전과 비교해서 성능이 크게 개선되지 않았다.
이번에는 넘파이의 log1p() 함수를 이용해서 로그 변환을 수행해보자.
def get_preprocessed_df(df=None):
    df_copy = df.copy()
    amount_n = np.log1p(df_copy['Amount'])
    df_copy.insert(0, 'Amount_Scaled', amount_n)
    df_copy.drop(['Time', 'Amount'], axis=1, inplace=True)
return df_copyX_train, X_test, y_train, y_test = get_train_test_dataset(card_df)
print('### 로지스틱 회귀 예측 성능 ###')
get_model_train_eval(lr_clf, ftr_train=X_train, ftr_test=X_test, tgt_train=y_train, tgt_test=y_test)
print('\n### LightGBM 예측 성능 ###')
get_model_train_eval(lgbm_clf, ftr_train=X_train, ftr_test=X_test, tgt_train=y_train, tgt_test=y_test)### 로지스틱 회귀 예측 성능 ###
오차행렬
[[85283 12]
[ 59 89]]
정확도: 0.9992, 정밀도: 0.8812, 재현율: 0.6014, F1: 0.7149, AUC:0.8006
### LightGBM 예측 성능 ###
오차행렬
[[85290 5]
[ 35 113]]
정확도: 0.9995, 정밀도: 0.9576, 재현율: 0.7635, F1: 0.8496, AUC:0.8817LightGBM의 경우 정밀도, 재현율, ROC-AUC에서 약간의 성능 개선이 있었다.
이상치 데이터 제거 후 모델 학습/예측/평가
plt.figure(figsize=(18, 18))
sns.heatmap(card_df.corr(), cmap='RdBu', annot=True)<matplotlib.axes._subplots.AxesSubplot at 0x7fc2aa0ec580>
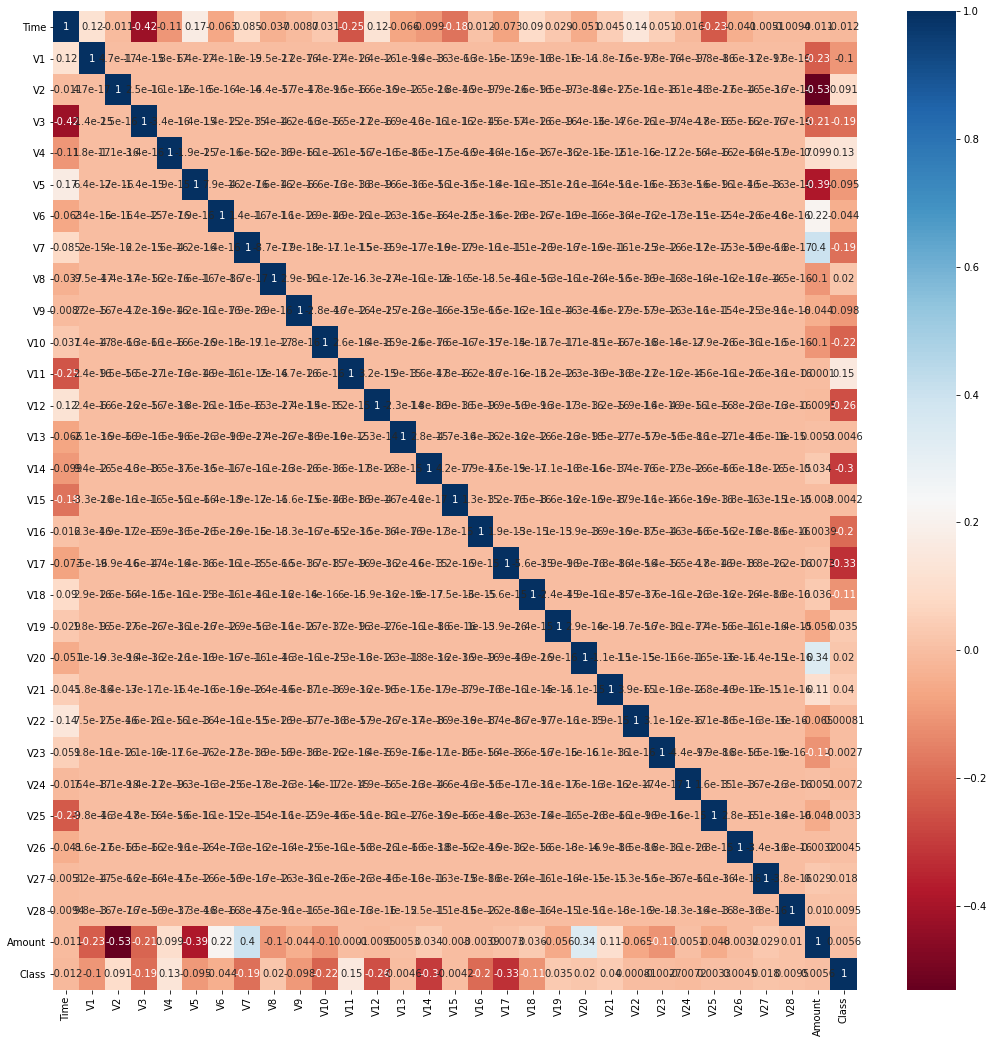
Class와 음의 상관관계가 가장 높은 피처는 V14(-0.3)와 V17(-0.33)이다. 이 중 V14에 대해서만 이상치를 찾아 제거해보자.
def get_outlier(df=None, column=None, weight=1.5):
fraud = df[df['Class'] == 1][column]
q25 = np.percentile(fraud.values, 25)
q75 = np.percentile(fraud.values, 75)
iqr = q75 - q25
iqr_weight = iqr * weight
low_val = q25 - iqr_weight
high_val = q75 + iqr_weight
outlier_index = fraud[(fraud < low_val) | (fraud > high_val)].index
return outlier_indexoutlier_index = get_outlier(df=card_df, column='V14', weight=1.5)
print(f'이상치 데이터 인덱스: {outlier_index}')이상치 데이터 인덱스: Int64Index([8296, 8615, 9035, 9252], dtype='int64')8296, 8615, 9035, 9252 번 Index가 이상치로 추출되었다. 이상치를 추출하고 삭제하는 로직을 get_processed_df() 함수에 추가해 다시 적용해보자.
def get_preprocessed_df(df=None):
df_copy = df.copy()
amount_n = np.log1p(df_copy['Amount'])
df_copy.insert(0, 'Amount_Scaled', amount_n)
df_copy.drop(['Time', 'Amount'], axis=1, inplace=True)
outlier_index = get_outlier(df=df_copy, column='V14', weight=1.5)
df_copy.drop(outlier_index, axis=0, inplace=True)
return df_copy
X_train, X_test, y_train, y_test = get_train_test_dataset(card_df)

print('### 로지스틱 회귀 예측 성능 ###')
get_model_train_eval(lr_clf, ftr_train=X_train, ftr_test=X_test, tgt_train=y_train, tgt_test=y_test)

print('\n### LightGBM 예측 성능 ###')
get_model_train_eval(lgbm_clf, ftr_train=X_train, ftr_test=X_test, tgt_train=y_train, tgt_test=y_test)
### 로지스틱 회귀 예측 성능 ###
오차행렬
[[85281 14]
[ 48 98]]
정확도: 0.9993, 정밀도: 0.8750, 재현율: 0.6712, F1: 0.7597, AUC:0.8355
### LightGBM 예측 성능 ###
오차행렬
[[85290 5]
[ 25 121]]
정확도: 0.9996, 정밀도: 0.9603, 재현율: 0.8288, F1: 0.8897, AUC:0.9144이상치 제거 후 로지스틱 회귀의 경우 재현율이 0.6014 에서 0.6712 로, LightGBM의 경우 0.7635 에서 0.8288 로 크게 증가했다.
SMOTE 오버 샘플링 적용 후 모델 학습/예측/평가
이번에는 SMOTE 기법으로 오버 샘플링을 적용한 뒤 두 모델의 예측 성능을 평가해보자, 단 SMOTE 를 적용할 때 반드시 학습 데이터 세트에만 오버 샘플링해야한다. 오버 샘플링은 fit_sample() 메서드를 사용한다.
from imblearn.over_sampling import SMOTE

smote = SMOTE(random_state=0)
X_train_over, y_train_over = smote.fit_sample(X_train, y_train)
print(f'SMOTE 적용 전 학습용 피처/레이블 데이터 세트: {X_train.shape, y_train.shape}')
print(f'SMOTE 적용 후 학습용 피처/레이블 데이터 세트: {X_train_over.shape, y_train_over.shape}')
print(f'SMOTE 적용 후 레이블 값 분포: \n{pd.Series(y_train_over).value_counts()}')
SMOTE 적용 전 학습용 피처/레이블 데이터 세트: ((199362, 29), (199362,))
SMOTE 적용 후 학습용 피처/레이블 데이터 세트: ((398040, 29), (398040,))
SMOTE 적용 후 레이블 값 분포:
1 199020
0 199020
Name: Class, dtype: int64SMOTE 적용 전 199362건이 적용 후 2배에 가까운 398040건으로 늘어났고, 레이블 값이 0과 1의 분포가 동일하게 199020개로 생성되었다.
lr_clf = LogisticRegression()
# ftr_train 과 tgt_train 인자 값이 SMOTE 증식된 X_train_over 와 y_train_over로 변경
get_model_train_eval(lr_clf, ftr_train=X_train_over, ftr_test=X_test, tgt_train=y_train_over, tgt_test=y_test)
오차행렬
[[82937 2358]
[ 11 135]]
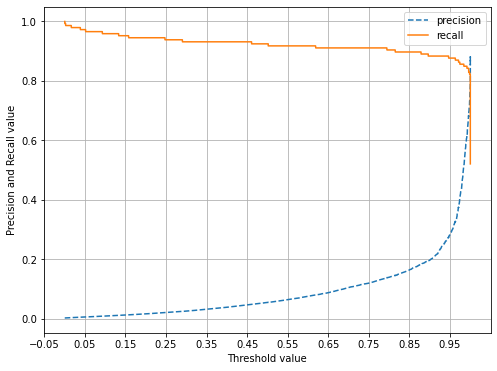
정확도: 0.9723, 정밀도: 0.0542, 재현율: 0.9247, F1: 0.1023, AUC:0.9485로지스틱 회귀는 SMOTE 적용 후 재현율이 0.6712 에서 0.9247 로 크게 증가하지만 정밀도가 0.8750 에서 0.0542 로 크게 저하된다. 어떠한 문제가 있는지 임곗값에 따른 정밀도와 재현율 곡선으로 알아보자.
from sklearn.metrics import precision_recall_curve
def precision_recall_curve_plot(y_test, pred_proba_c1):
    # threshold ndarray와 이 threshold에 따른 정밀도, 재현율 ndarray 추출
    precisions, recalls, thresholds = precision_recall_curve(y_test, pred_proba_c1)

    # X축을 threshold값으로, Y축은 정밀도, 재현율 값으로 각각 Plot 수행, 정밀도는 점선으로 표시
    plt.figure(figsize=(8, 6))
    threshold_boundary = thresholds.shape[0]
    plt.plot(thresholds, precisions[0:threshold_boundary], linestyle='--', label='precision')
    plt.plot(thresholds, recalls[0:threshold_boundary], label='recall')

    # threshold 값 X축의 scale을 0.1 단위로 변경
    start, end = plt.xlim()
    plt.xticks(np.round(np.arange(start, end, 0.1), 2))

    # X, Y축 label과 legend, grid 설정
    plt.xlabel('Threshold value')
    plt.ylabel('Precision and Recall value')
    plt.legend()
plt.grid()precision_recall_curve_plot(y_test, lr_clf.predict_proba(X_test)[:, 1])
0.99 이하에서 재현율이 매우 좋고, 정밀도가 극단적으로 낮다가 0.99 이상에서 반대로 값이 증가하고 감소한다. 임곗값을 조정하더라도 민감도가 너무 심해 올바른 재현율/정밀도 성능을 얻을 수 없다.
이번에는 LightGBM 모델을 오버 샘플링 해보자.
lgbm_clf = LGBMClassifier(n_estimators=1000, num_leaves=64, n_jobs=-1, boost_from_average=False)
get_model_train_eval(lgbm_clf, ftr_train=X_train_over, ftr_test=X_test, tgt_train=y_train_over, tgt_test=y_test)
오차행렬
[[85283 12]
[ 22 124]]
정확도: 0.9996, 정밀도: 0.9118, 재현율: 0.8493, F1: 0.8794, AUC:0.9246이상치만 제거한 경우와 비교해서 재현율이 0.8288 에서 0.8493 으로 높아졌고, 정밀도는 0.9603 에서 0.9118 로 낮아졌다. 일반적으로 SMOTE 를 적용하면 재현율은 높아지지만 정밀도는 떨어진다
파이썬 머신러닝 완벽 가이드 / 위키북스
