
https://www.kaggle.com/c/sejongai19011494/overview
제주도 날씨 및 관광객 정보에 따른 카드 소비금액 예측하기
주어진 데이터를 사용하여 관광객들의 카드 소비 금액을 예측하는 문제입니다.
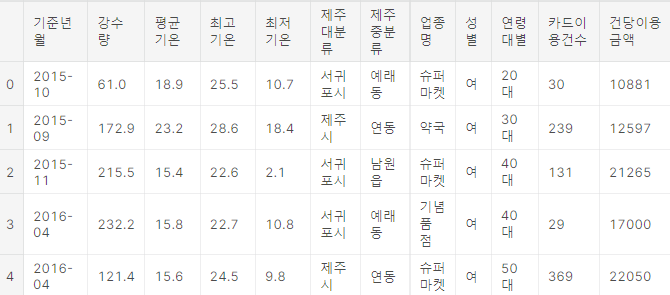
본 문제에서는 2016년 9월부터 2018년 8월까지의 월 별 기온 및 강우량, 관광객들의 정보를 포함한 총 11개의 feature가 주어집니다. 해당 데이터들을 이용해 관광객들의 카드 소비금액을 예측하시면 됩니다.
주어지는 데이터는 아래와 같습니다.
- 기준년월 : 관광객의 소비금액이 측정된 년월
- 제주 대분류 : 제주도 내 시
- 제주 중분류 : 제주도 내 동, 읍
- 업종명 : 관광객이 카드를 사용한 업종
- 성별 : 관광객의 성별
- 연령대 : 관광객의 연령대
- 카드이용건수 : 관광객의 월 카드이용건수
- 평균 강수량 : 월 평균 강수량
- 평균 기온 : 카드 이용장소의 월 평균 기온
- 최저 기온 : 카드 이용장소의 월 최저 기온
- 최고 기온 : 카드 이용장소의 월 최고 기온
Data Load
# This Python 3 environment comes with many helpful analytics libraries installed
# It is defined by the kaggle/python Docker image: https://github.com/kaggle/docker-python
# For example, here's several helpful packages to load

import numpy as np # linear algebra
import pandas as pd # data processing, CSV file I/O (e.g. pd.read_csv)
import torch
import torch.optim as optim # torch  선언
torch.manual_seed(1)

import random
random.seed(1)

device = 'cuda' if torch.cuda.is_available() else 'cpu'
if device == 'cuda':
      torch.cuda.manual_seed_all(1)
# Input data files are available in the read-only "../input/" directory
# For example, running this (by clicking run or pressing Shift+Enter) will list all files under the input directory

import os
for dirname, _, filenames in os.walk('/kaggle/input'):
    for filename in filenames:
        print(os.path.join(dirname, filename))

# You can write up to 20GB to the current directory (/kaggle/working/) that gets preserved as output when you create a version using "Save & Run All"
# You can also write temporary files to /kaggle/temp/, but they won't be saved outside of the current session

X = pd.read_csv('/kaggle/input/sejongai19011494/train-1.csv')
y = X['건당이용금액']
test = pd.read_csv('/kaggle/input/sejongai19011494/test-1.csv')
X.head()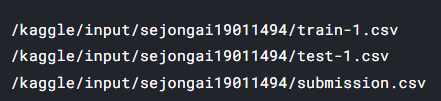
Module Import & Cuda Setting
import numpy as np
import pandas as pd
import torch
import torch.nn as nn
import torch.optim as optim
import random
from sklearn.preprocessing import StandardScaler
from sklearn.metrics import mean_squared_error
from math import sqrt

device ='cuda' if torch.cuda.is_available() else 'cpu'

random.seed(777)
torch.manual_seed(777)
if device == 'cuda' :
  torch.cuda.manual_seed_all(777)

device
Data Parsing
X['연도'] = X['기준년월'].str.split('-').str[0].astype(int)
X['월'] = X['기준년월'].str.split('-').str[1].astype(int)
X = X.drop([ '기준년월', '건당이용금액'], axis=1)

test['연도'] = test['기준년월'].str.split('-').str[0].astype(int)
test['월'] = test['기준년월'].str.split('-').str[1].astype(int)
test = test.drop(['기준년월'], axis=1)
연도와 월을 구분하여 따로 저장해주었습니다.
Preprocessing
list =['제주 대분류', '제주 중분류', '업종명', '성별', '연령대별']

from sklearn import preprocessing
le = preprocessing.LabelEncoder()

for c in list:
    label = pd.concat([X[c], test[c]], axis=0)
    le.fit(label)
    X[c] = le.transform(X[c])
    test[c] = le.transform(test[c])
'제주 대분류', '제주 중분류', '업종명', '성별', '연령대별'열만 뽑아 라벨링 해주었습니다.
X = torch.FloatTensor(X.to_numpy()).to(device)
test = torch.FloatTensor(test.to_numpy()).to(device)
y = torch.FloatTensor(y.to_numpy()).to(device)

X_sc = torch.FloatTensor(X_sc).to(device)
test_sc = torch.FloatTensor(test_sc).to(device)
Model
class NN(torch.nn.Module):
    def __init__(self):
        super(NN,self).__init__()

        self.linear1 = nn.Linear(12,512,bias=True)
        self.linear2 = nn.Linear(512,256,bias=True)
        self.linear3 = nn.Linear(256,256,bias=True)
        self.linear4 = nn.Linear(256,1,bias=True)
        self.relu = nn.ReLU()
        self.dropout = torch.nn.Dropout(0.2)


        #for m in self.modules():
        #    if isinstance(m, nn.Linear):
        #       nn.init.xavier_normal_(m.weight.data)

    def forward(self,x):
        out = self.linear1(x)
        out = self.relu(out)
        out = self.dropout(out)
        out = self.linear2(out)
        out = self.relu(out)
        out = self.dropout(out)
        out = self.linear3(out)
        out = self.relu(out)
        out = self.dropout(out)
        out = self.linear4(out)
        return out

model = NN().to(device)
model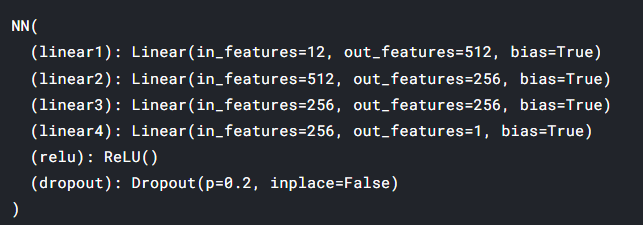
Training
plt_rms = []
plt_los = []
# 모델 학습
model.train()
loss = torch.nn.L1Loss()
optimizer = optim.Adam(model.parameters(), lr=10e-3)

for epoch in range(2801):
    hypothesis = model(X_sc)
    cost = loss(hypothesis, y.unsqueeze(1))
    optimizer.zero_grad()
    cost.backward()
    optimizer.step()

    rms = sqrt(mean_squared_error(y.detach().cpu().numpy(), hypothesis.detach().cpu().numpy()))
    plt_rms.append([rms,cost])
    #plt_los.append([cost])
    if epoch%100==0:
        print("Epoch : ",epoch," Cost : ",cost.item()," RMSE : ", rms)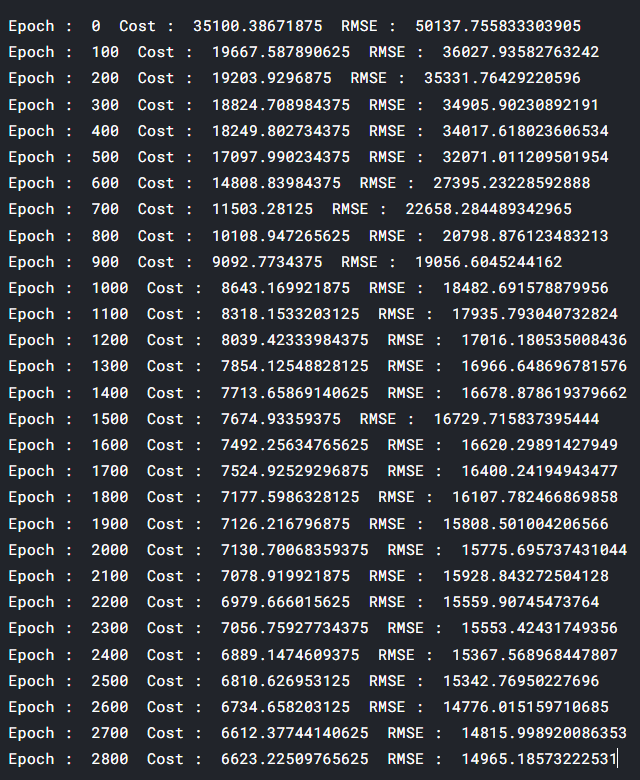
Plot function
import matplotlib.pyplot as plt

def plot(loss_list: list, ylim=None, title=None) -> None:
    bn = [i[0] for i in loss_list]
    nn = [i[1] for i in loss_list]

    plt.figure(figsize=(10, 10))
    plt.plot(bn, label='rms')
    plt.plot(nn, label='cost')
    if ylim:
        plt.ylim(ylim)

    if title:
        plt.title(title)
    plt.legend()
    plt.grid('on')
plt.show()plot(plt_rms , [5000.0, 30000.0], title='Loss at Epoch')
#plot(plt_los , [4000.0, 20000.0], title='Loss at Epoch')
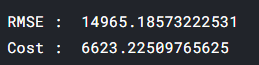
print("RMSE : ",rms)
print("Cost : ", cost.item())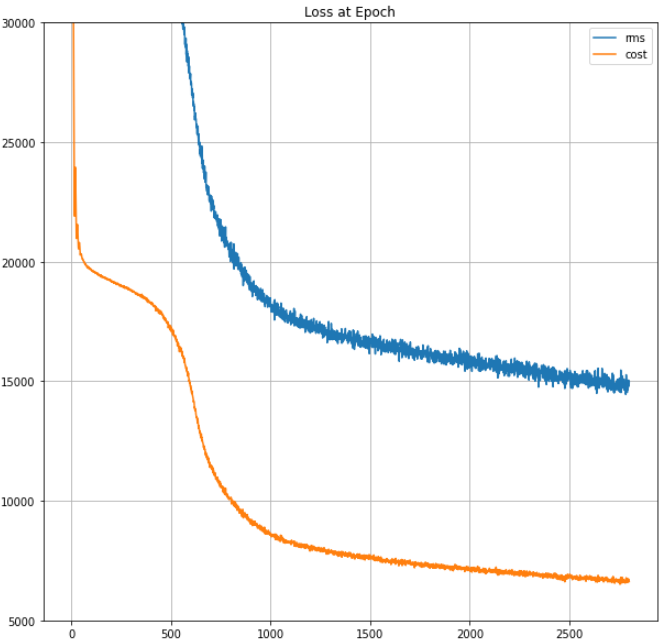
Predict
model.eval()
with torch.no_grad():
    predict = model(test_sc).cpu()
    predict = predict.detach().numpy().squeeze(1)
Submit
submission = pd.read_csv('/kaggle/input/sejongai19011494/submission.csv')
submission['Predicted'] = predict

submission.to_csv("submission.csv", index=False)
submission.head()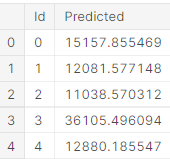

✏️세상의 모든 기록 ✏️