🧩 Clustering
cluster : 무리, 송이
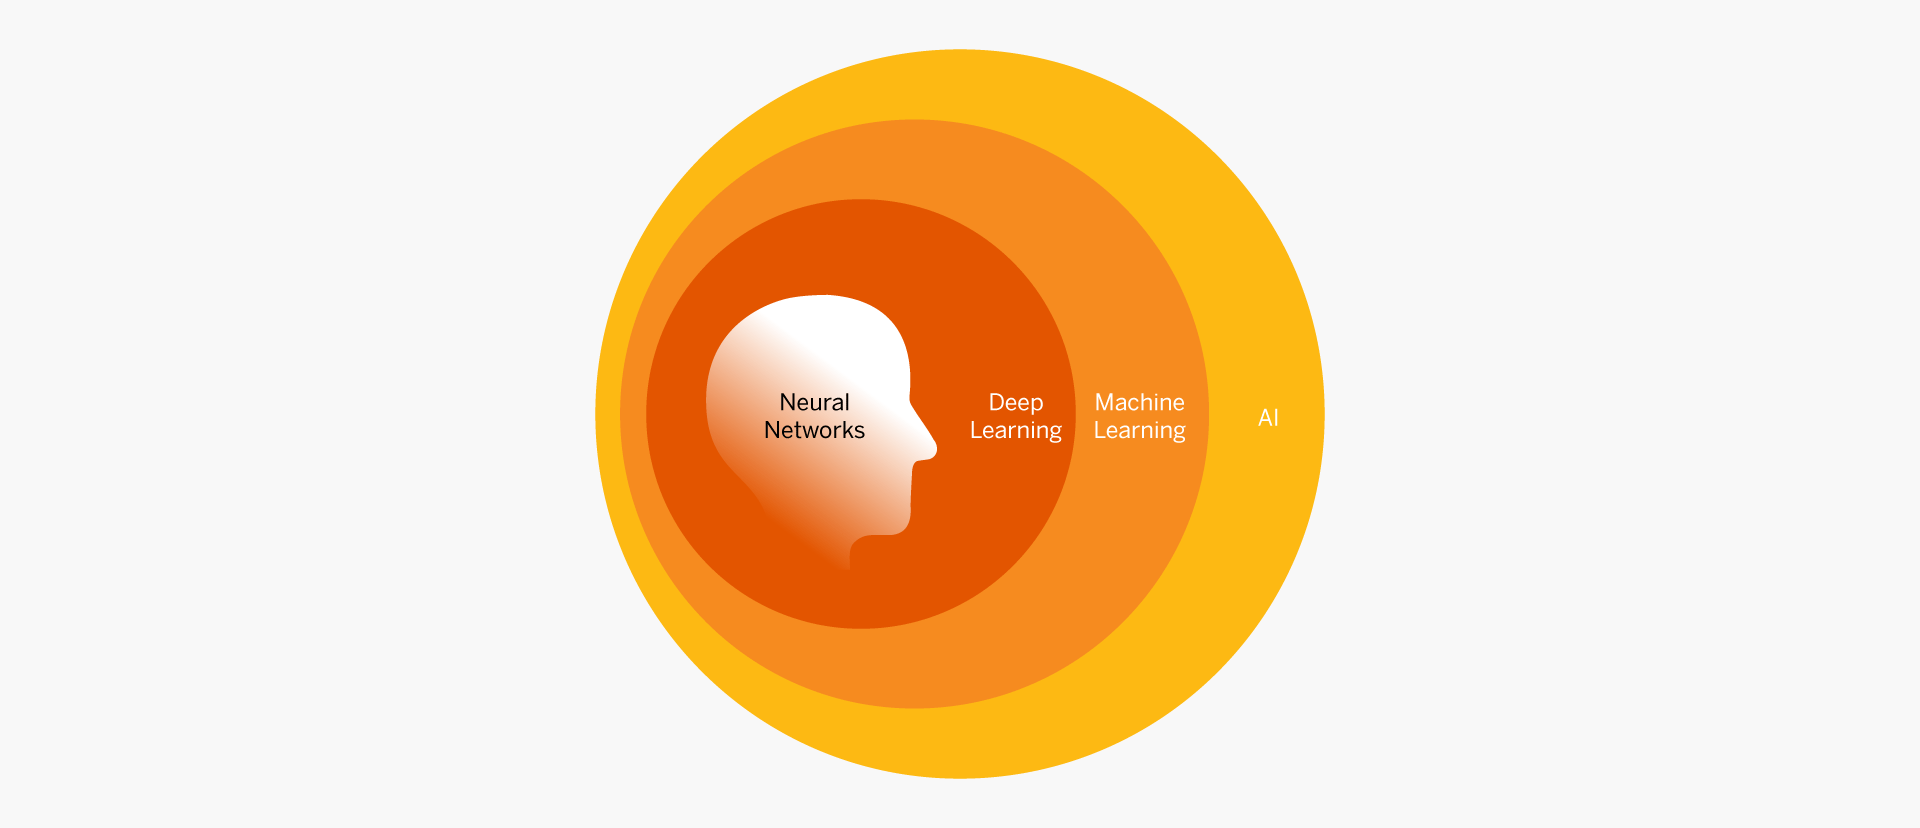
레이블이 있는 데이터: Supervised Learning
레이블이 없는 데이터: Unsupervised Learning
데이터 프레임이나 데이터 자료들에서 데이터들은 하나의 Column에 같은 특성(레이블)끼리 모여있다.
그렇지 않을 때_ Unsupervised Learning _엔 데이터 처리가 어렵기 때문에 같은 레이블로 데이터를 묶어주어야 한다.
그것이 클러스터링!
📌 K-Mean Clustering Analysis
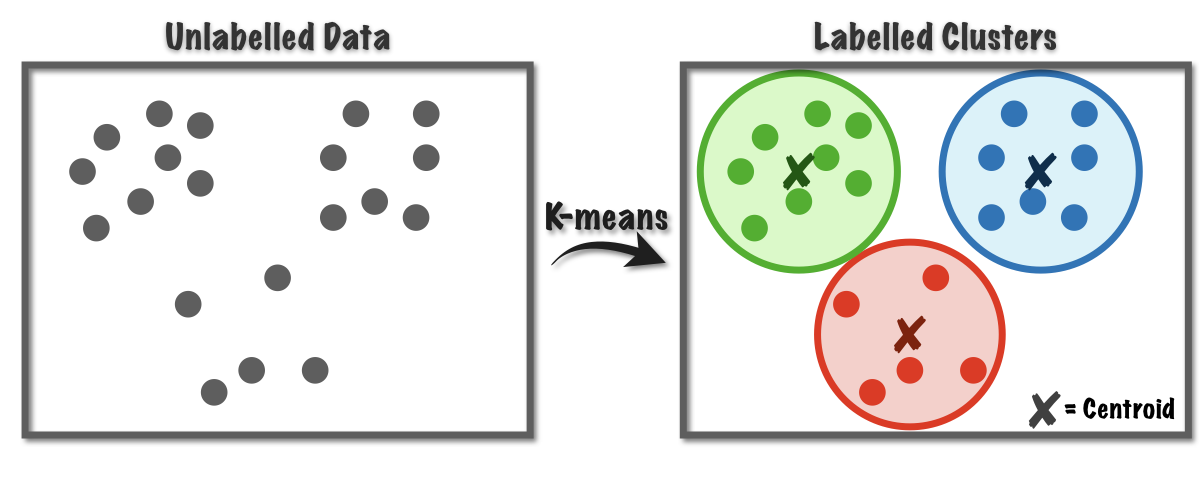
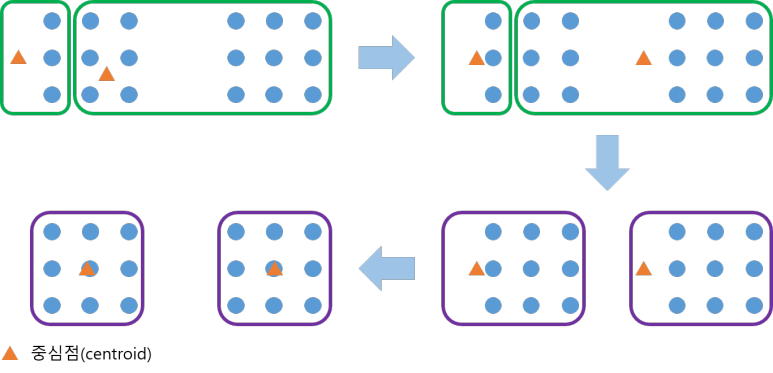
- 레이블이 없는 데이터들에서 임의로 K개의 Centroid를 지정 (가상의 Centroid)
- K에서 거리가 비슷한 데이터들을 묶어 클러스터를 만든다.
(분산은 흩어져있는 데이터를 뜻하니까)
(거리는 L1 Norm, L2 Norm으로 설정할 수 있다.) - 만든 클러스터 안의 데이터들로 새로 평균을 구하여 Centroid로 설정
- 2,3번 반복하며 정답에 수렴해 나간다.
🏁 내 풀이(K-mean Clustering)
import numpy as np
from sklearn.cluster import KMeans

scaler = StandardScaler()
kmeans = KMeans(n_clusters=2, random_state=42).fit(features)
label01 = pd.DataFrame(kmeans.labels_)
✔️ StandardScaler()
"정규화"
데이터 프레임 내에서나, 데이터들 안에서는 Column마다 데이터의 값들이 다르고 평균도 다르다.
이 데이터들을 그대로 클러스터링 하게 되면
- 제대로 데이터들의 평균에 접근이 불가능하고
- 단순히 숫자의 크고작음에 인해 중요성이 결정된다.
이런 문제를 없애기 위해 데이터들의 스케일을 맞춰주는
StandardScaler를 먼저 진행한다.
✔️ Kmeans(n_clusters=None, random_state=None)
- n_clusters : 만들 군집의 수
- random_state : 중심 초기화를 위한 난수 생성을 결정
- fit(x) : K-Mean 클러스터링 계산
📌 Scree Plot
제일 적합한 K-Mean Clustering을 어떻게 확인할까?
Scree Plot 으로 확인한다!
Screeplot : 각 개별 Principal Component의 고유값을 보여주는 간단한 line plot.
Scree Plot은 주성분의 수를 만드는 요인을 결정한다.
🏁 내 풀이(Scree Plot)
def scree_plot(pca):
num_components = len(ratio) # variance ratio 개수
ind = np.arange(num_components)
vals = ratio
ax = plt.subplot()
cumvals = np.cumsum(vals) # vals 누적된 값 계산
ax.bar(ind, vals, color = ['green','blue']) # Bar plot
ax.plot(ind, cumvals, color = '#c0392b') # Line plot
ax.set_xlabel("PC")
ax.set_ylabel("Variance")
plt.title('Scree plot')
pca = PCA(4) # principal n_components = 4
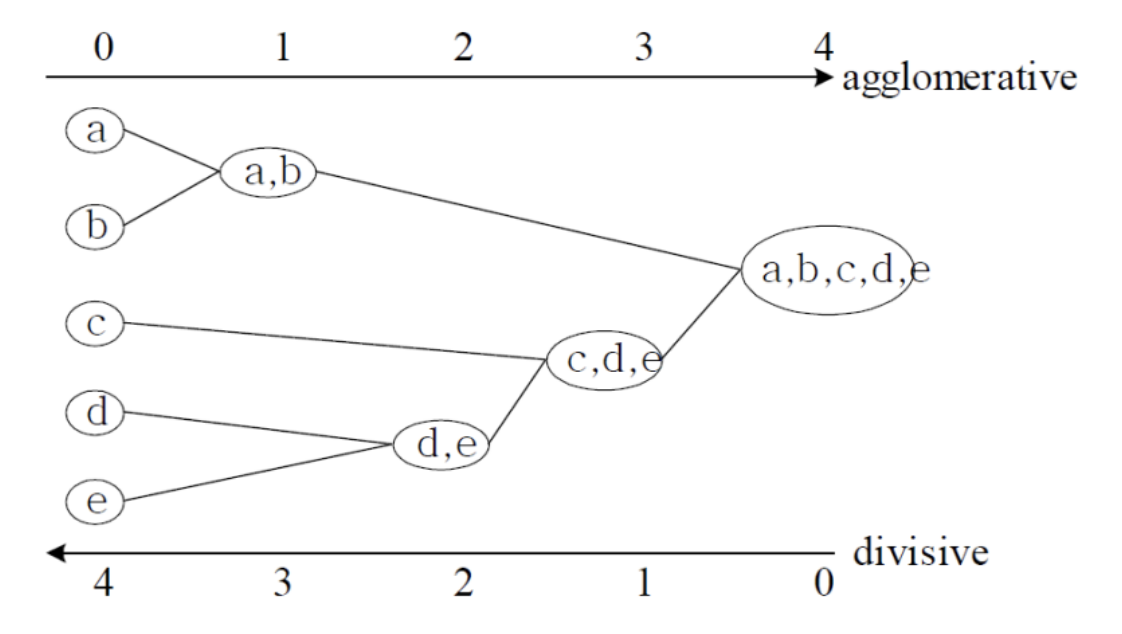
scree_plot(pc_df)📌 Hierachical Clustering Analysis(HCA)
Hierachical : 계층제의
- 레이블이 없는 데이터들을 다 하나의 클러스터라고 가정한다.
- 거리를 계산하여 가장 가까운 거리의 데이터와 하나의 페어로 묶는다.
- 하나의 클러스터가 될 때까지 반복한다.
나는 HCA의 Dendrogram이 토너먼트 게임과 아주 비슷하다고 생각했다!
🏁 내 풀이(Hierarchy Clustering)
from sklearn.cluster import AgglomerativeClustering
import numpy as np
clustering = AgglomerativeClustering().fit(label01) # clustering 후: label01
clustering.labels_

# Dendrogram Visualization

import matplotlib.pyplot as plt
import seaborn as sns
from scipy.cluster.hierarchy import linkage, dendrogram
import scipy.cluster.hierarchy as shc

plt.figure(figsize=(10, 7))
plt.title("Breast cancer dendrograms")
dend = shc.dendrogram(shc.linkage(features, method='ward')) # Ward 연결법 (Ward Linkage Method)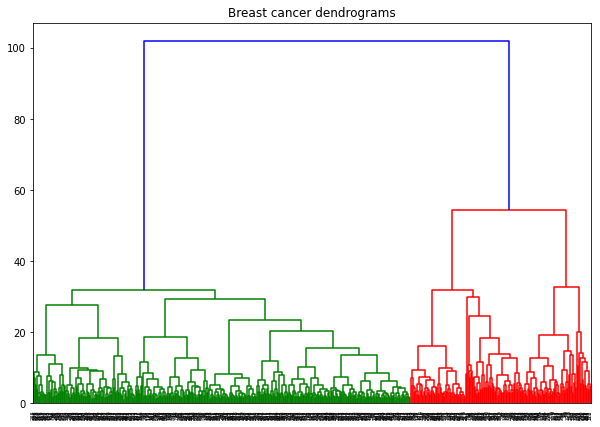

Engineer