모델을 평가할 때, Accuracy 지표만 들여다보는 것으로 부족할 때가 있다.
그래서 라벨 0인걸 몇개 맞췄느냐, 라벨 1인걸 몇개를 맞췄느냐 이런식으로 세부적으로 볼 수 있는 classification_report라는 기능이 있다. (precision / recall / f1-score)
Precision과 Recall은 특히 이진 분류에서 많이 쓰인다.
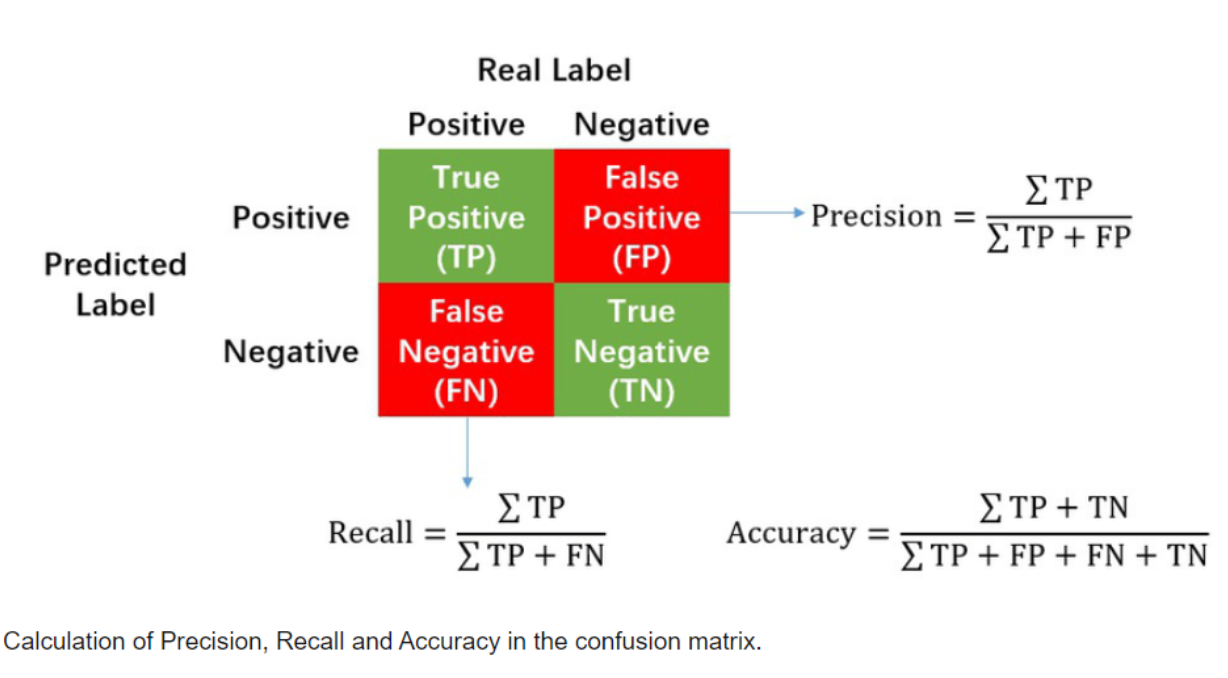
기본 개념 다시 정리
이진 분류 결과는 이렇게 네 가지로 나뉘었었다:
| 실제 클래스 | 예측 클래스 | 용어 |
|---|---|---|
| Positive | Positive | TP (True Positive) |
| Positive | Negative | FN (False Negative) |
| Negative | Positive | FP (False Positive) |
| Negative | Negative | TN (True Negative) |
Precision (정밀도)
예측한 Positive 중에서 실제로 Positive인 비율

예시:
- 스팸 필터가 100개의 이메일 중 20개를 스팸이라고 했는데, 그 중 15개만 진짜 스팸이었다면?
- Precision = 15 / 20 = 0.75 (75%)
해석:
- 정답률. "스팸이라고 찍은 것 중에, 실제 스팸은 몇 개나 맞췄냐?"
Recall (재현율)
예측한 Positive 중에서 실제로 Positive인 비율

예시:
- 실제 스팸이 30개였는데, 그 중 15개만 스팸으로 잘 잡아냈다면?
- Recall = 15 / 30 = 0.5 (50%)
해석:
- 놓치지 않고 잘 잡았는지 평가하는 지표. "실제 스팸을 얼마나 잘 걸러냈냐?"

둘은 Trade-off 관계!
- Precision을 높이면 FP를 줄이기 때문에 보수적으로 예측하는 것
- Recall을 높이면 FN을 줄이려고 좀 더 적극적으로 예측하는 것
예:
- 암 진단 모델에서 Recall이 중요 (암인데 암이 아니라고 하면 큰일!)
- 반면 법적 시스템에서는 Precision이 중요 (무고한 사람을 범인으로 만들면 안 되니까!)
F1-score
그런 둘 사이 밸런스를 잘 맞춰주는 지표가 F1-score:

실습
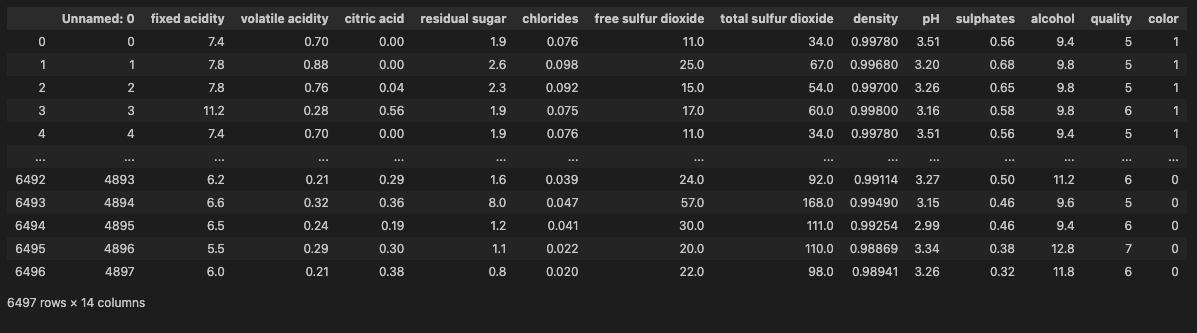
계속 사용하던 wine 데이터 불러오기. taste 컬럼을 생성해주고, X와 y를 나눠줌:
wine['taste'] = [1. if grade > 5 else 0. for grade in wine['quality']]

X = wine.drop(['taste', 'quality'], axis=1)
y = wine['taste']
Data split 해주고 Logistic Regression으로 훈련:
from sklearn.model_selection import train_test_split

X_train, X_test, y_train, y_test = train_test_split(X, y, test_size=0.2, random_state=13)
from sklearn.linear_model import LogisticRegression
from sklearn.metrics import accuracy_score

lr = LogisticRegression(solver='liblinear', random_state=13)
lr.fit(X_train, y_train)
accuracy 확인해보면:
y_pred_tr = lr.predict(X_train)
y_pred_test = lr.predict(X_test)

accuracy_score(y_train, y_pred_tr), accuracy_score(y_test, y_pred_test)
74%
classification_report():
테스트 데이터 정답과 예측 결과 넘겨주기
from sklearn.metrics import classification_report, confusion_matrix

print(classification_report(y_test, y_pred_test))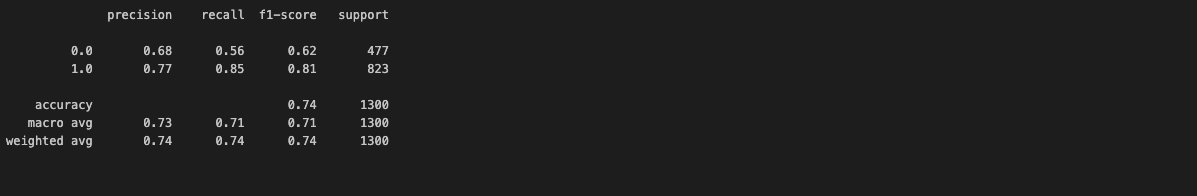
confusion_matrix():
confusion_matrix(y_test, y_pred_test)
confusion matrix의 형태:
실제 0 [ 예측 0 (맞춤), 예측 1 (틀림)]
실제 1 [ 예측 0 (틀림), 예측 1 (맞춤)]
precision & recall 그래프
import matplotlib.pyplot as plt
from sklearn.metrics import precision_recall_curve

plt.figure(figsize=(10, 7))
pred = lr.predict_proba(X_test)[:, 1]
precision, recall, thresholds = precision_recall_curve(y_test, pred)
plt.plot(thresholds, precision[:-1], label='precision') # threshold마다 precision 그래프 그리기
plt.plot(thresholds, recall[:-1], label='recall')
plt.grid()
plt.legend()
plt.show()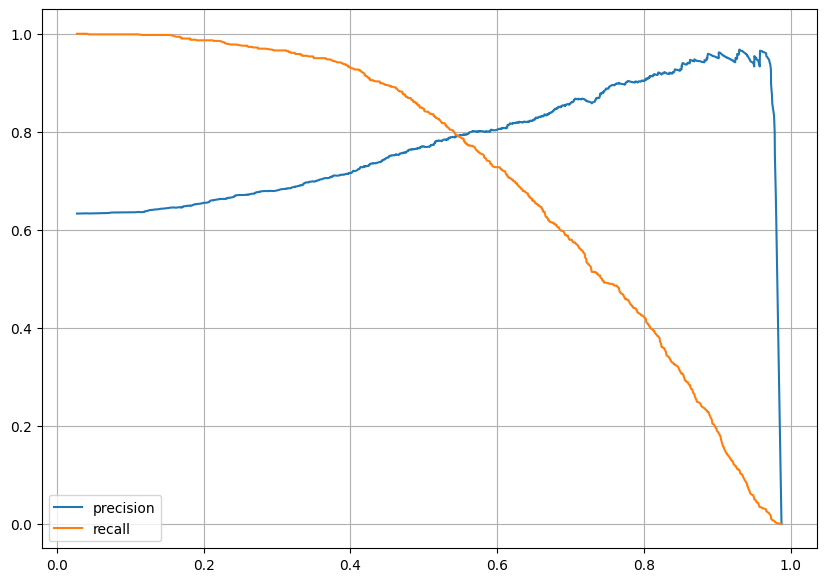
트레이드 오프 관계성을 확인할 수 있었다.
Threshold 조정해보기
predict probability 확인 (데이터를 각각 0, 1로 예측할 확률에 대한 정보):
pred_proba = lr.predict_proba(X_test)
pred_proba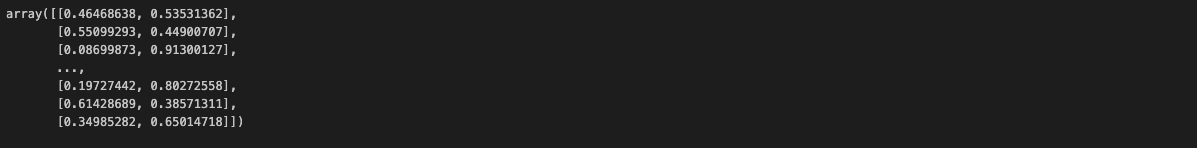
pred_proba에 2차원 행렬로 변경한 y_pred_test 붙여주고:
(Binarizer는 2D 배열 (행렬 형태)을 입력으로 받음)
import numpy as np

np.concatenate([pred_proba, y_pred_test.reshape(-1, 1)], axis=1)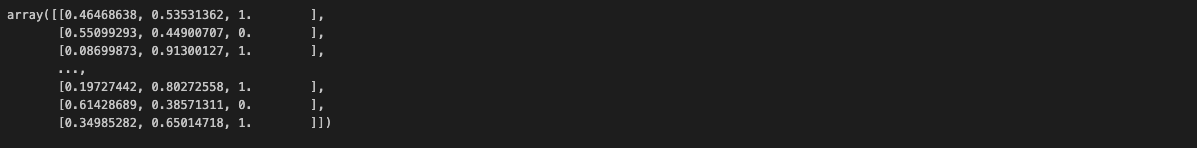
Binarizer로 fit:
(Binarizer는 설정한 threshold(기준값)보다 크면 1, 작거나 같으면 0으로 변환해주는 변환기)
from sklearn.preprocessing import Binarizer

biz = Binarizer(threshold=0.6).fit(pred_proba)
pred_bin = biz.transform(pred_proba)[:,1]
pred_bin[:5]
예측값이 요렇게 나온다 .
classification_report 확인해보면:
print(classification_report(y_test, pred_bin))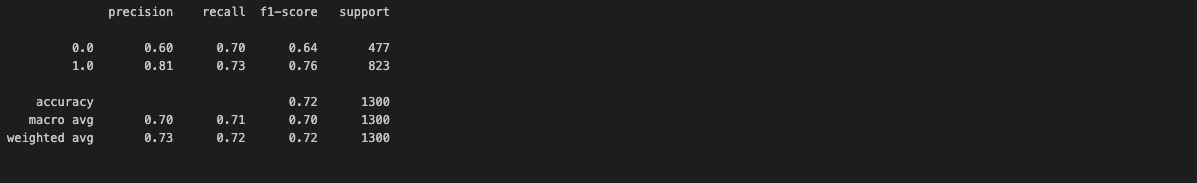
수치가 좋아진 것을 확인할 수 있다.
confusion_matrix(y_test, pred_bin)
성과도 좋아졌다. 😃
(이 글은 제로베이스 데이터 취업 스쿨의 강의 자료 일부를 발췌하여 작성되었습니다.)