Statistical Learning?
Predicttarget data usingObservation or Given Data
- :
Target Variable,Response Variable - : so called
Predictor,Features,Inputs - Let just say
- Then
Input Vectorcould be like this - Now we could wrtie our
statistical modelasWhere captures measurement errors and other discrepancies
What is f(X) good for?
-
With a goof : Function f, we can make
predictionsof at new points . -
We can understand which components of are important in explaining
-
There could be
extra featureslike Seniority, Years of education and Incom etc. -
Depending on the
complexityof , we may be able to understand how each component of affects
-
Is there an ideal ?
What is goof value for at any selected value of , say ??
There can bemany Y valuesat . -
A good value is
Expected value=Average -
This ideal is called
regression function
The regression function f(x)
- It also defined for vector
- Is the
idealoroptimalpredictor of with regard tomean-squared prediction error- is the function that
minimizeover all functions at all points .
- is the function that
- is the
irreducible error- For any estimate of , we have
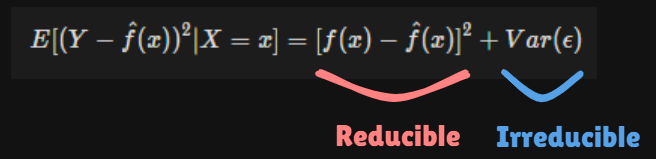
- For any estimate of , we have
How to estimate f
- Typically we have few if any data points with exactly.
- So we cannot compute !
- Realex the definition and let
where is some
neighborhoodof

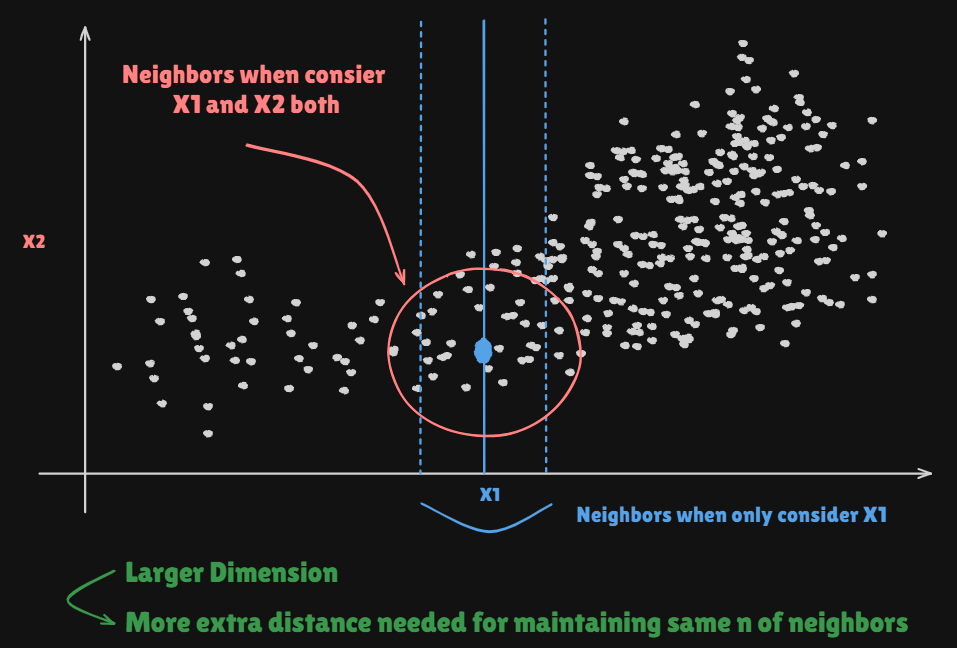
Nearst neighrbor averageingcan be pretty good forsmall p, pparameterNearst neighbor methods can be
lousywhenp is large.Reason : the
curse of dimesionalityNearst neighbors tend to be far away in high dimensions.- We neeed to get a reasonable fraction of the values of to average to bring the variance down. e.g.) 10%
- A 10% neighrborhood in high dimensions need no longer be local, so we lose the spirit of estimating
bylocal averaging
Parametric and structured models
Linear modelis an important example of aparametric model:
- We estimate the parameters by
fittingthe model totraining data. - Although it is
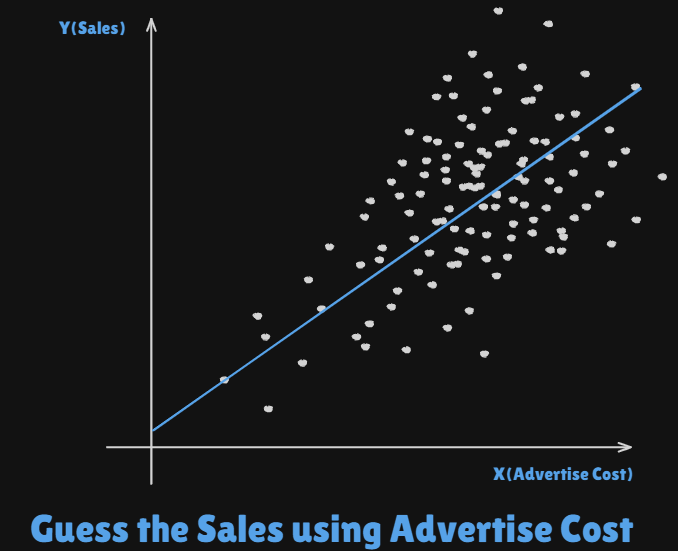
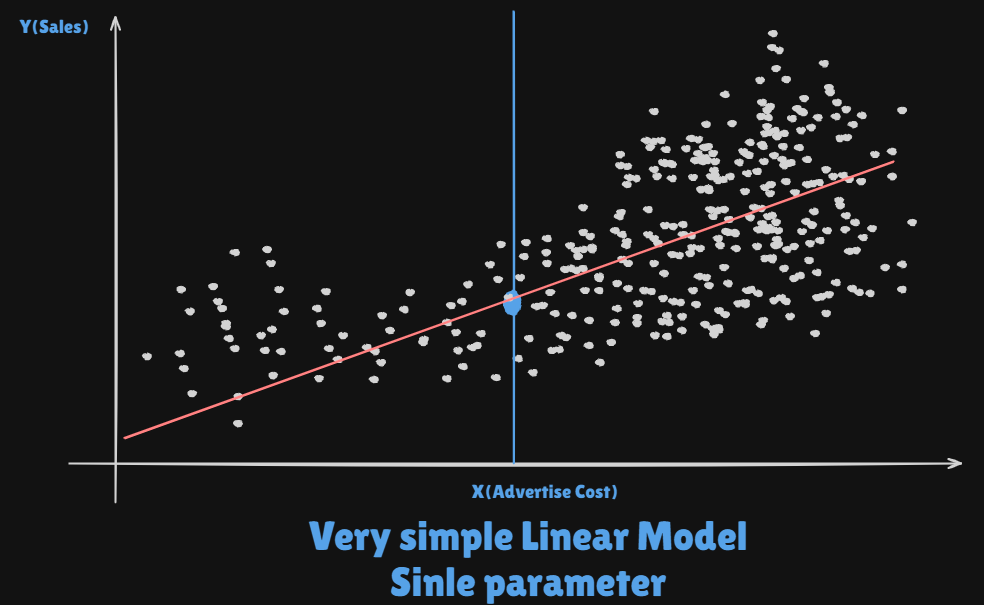
almost never correct, alinear modeloften serves as a good andinterpretable approximationto the unknown true function . - A simple
Linear modelgives a reasonable fit here
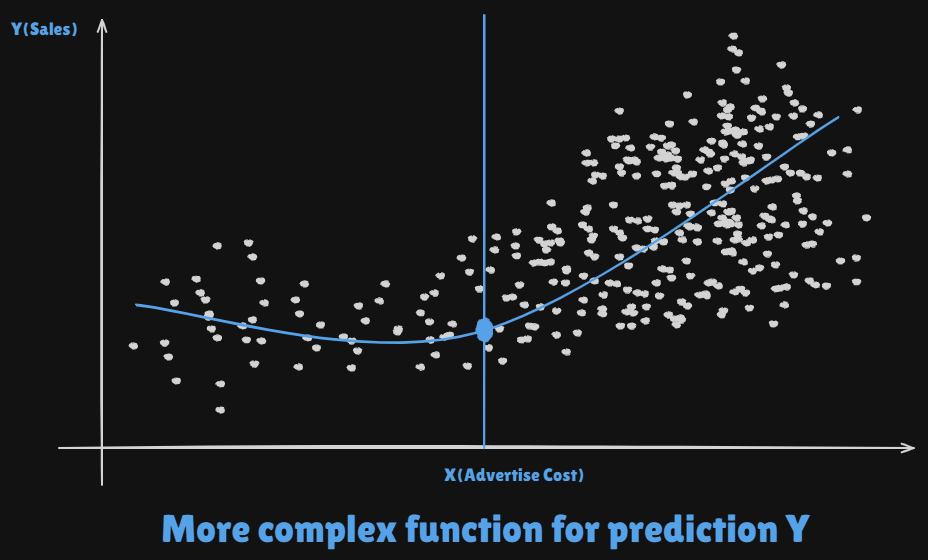
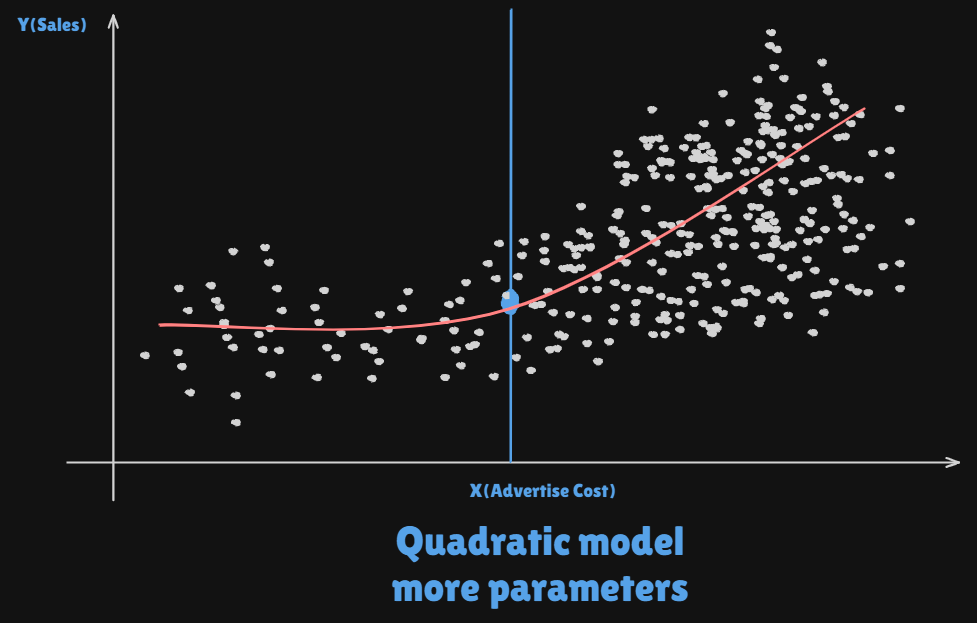
- A
quadratic modelfits slightly better.

- Simulated example.
Red pointsare simulated values forincomefrom the model
is theblue surface,estimator

Linear Regression modelfit to the simulated data.

- More flexible regression model fit to the simulated data.
- Here we use a technique called a
thin-plate splineto fit a flexible surface. - Just control the
roughnessof the fit.Even more flexible
spline regression modelOverfitted
- Simulated example.
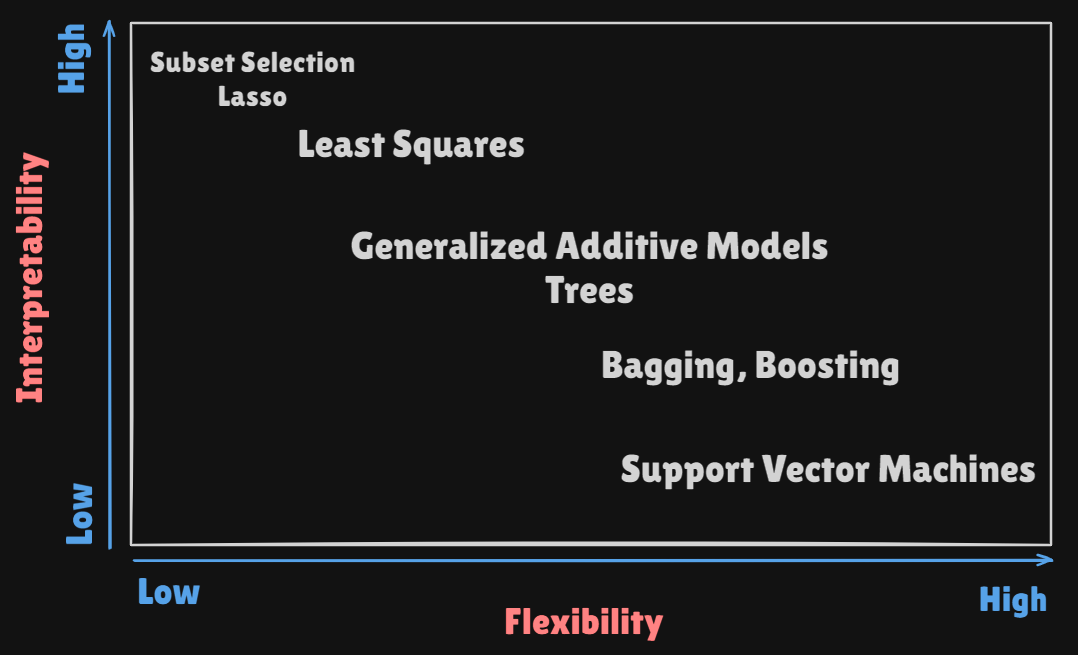
Some trade-offs(Interpretability vs Flexibility)
- Prediction
accuracyversusinterpretabilityLinear modelsare easy tointerpretbut...thin-plate splinesare not easy tointerpret
Good fitversusover-fitorunder-fit- How do we know when the
fitis just right?
- How do we know when the
Parsimony(Simply interpretable model) versusblack-box- We often prefer a simpler model involving fewer variables over a
black-boxpredictor involving them all.
- We often prefer a simpler model involving fewer variables over a
Assessing Model Accuracy
- Suppose we fit a model to some training data
, and we wish to see how well it performs.Average squared prediction errorovertrainning error
- This may be biased toward more overfit models.
test error- Instead we should, if possible, compute it using fresh
test data: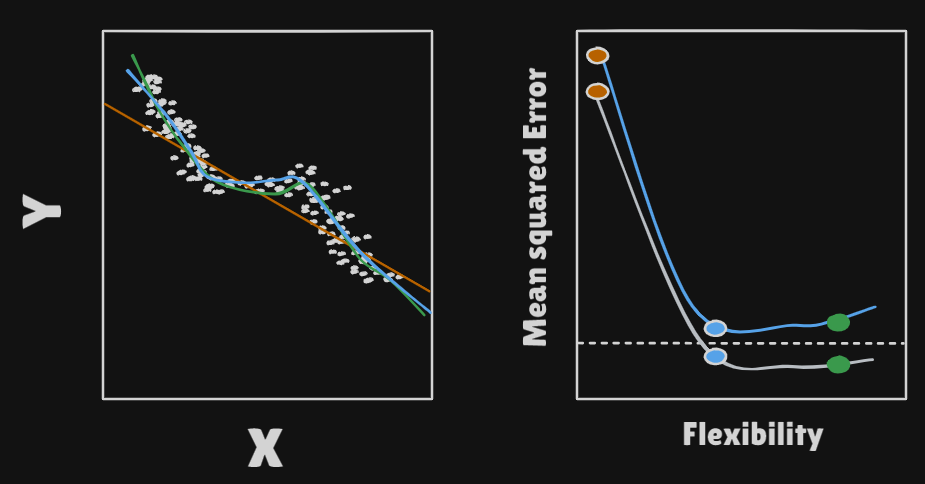
- Instead we should, if possible, compute it using fresh
- means overfitted regression model, means
Ground Truth, meansSimple Linear model
Bias-Variance Trade-off
-
Suppose we have fit a model to some
training data, and let be atest observationdrawn from the population. -
If the
true modelis (with ), then -
The
expectation averagesover the variability of as well as the variability in .Note that
-
Typically as the
flexibilityofincreases, itsvarianceincreases, and itsbiasdecreases -
So choosing the flexibility based on
average test erroramounts to abias-variance trade-off -
Example

Classification Problems
- Here the response variable is
qualitative- e.g. email is one ofOut goadls are to:
- Build a
classifierthat assigns aclass labelfrom to a futureunlabeled observation. - Assess the
uncertaintyin eachclassification - Understand the roles of the different
predictorsamong
$$X=(X_1,X_2,\cdots,X_p)
- Build a
- Is there an ideal ? Let
- These are the
conditional class probabilitiesat ;Then the
bayes optimalclassifier at is

Nearest-neighbor averagingcan be used as before.- Also breaks down as
dimension grows. However, the impact on is less than on .
Classification : some details
- Typically we measure the performance of using the
misclassification error rate - The
Bayes classifier(using the true ) hassmallest error(in the population) Support-vector machinesbuild structured models for . etc.