K-최근접 이웃 (K-Nearest Neighbors, KNN)
1. KNN이란?
- KNN(K-Nearest Neighbors)은 지도 학습(Supervised Learning) 알고리즘
- 새로운 데이터가 들어왔을 때 가장 가까운 K개의 데이터를 참고하여 분류(Classification) 또는 회귀(Regression)를 수행하는 방식
특징
- 거리를 기반으로 판단하는 비모수(non-parametric) 알고리즘
- 학습 과정이 거의 없고, 예측 시 계산이 많이 필요한 Lazy Learning(게으른 학습)
- K 값(이웃 개수)을 설정하는 것이 중요
2. KNN 알고리즘 동작 원리
- 새로운 데이터가 들어오면 모든 데이터 포인트와의 거리(유클리드 거리 등)를 계산
- 가장 가까운 K개의 이웃을 찾음
- 분류(Classification): K개의 이웃 중 가장 많은 클래스로 예측
- 회귀(Regression): K개의 이웃의 평균(또는 가중 평균)으로 예측
📝 유클리드 거리(Euclidean Distance) 공식
3. KNN 확률적 해석
KNN 분류기의 예측 확률의 정의:
수식 설명
- : 새로운 샘플 가 클래스 에 속할 확률
- : 와 가장 가까운 K개의 이웃 집합
- : 데이터 샘플 의 클래스가 이면 1, 아니면 0을 반환하는 Indicator 함수
- 즉, K개의 최근접 이웃 중에서 클래스 에 속하는 샘플의 비율을 확률로 사용
이 방식은 단순히 다수결 원칙을 확률적으로 표현한 것으로, 확률값을 직접 계산하는 대신 이웃한 데이터가 많이 속한 클래스를 선택하는 방식입니다.
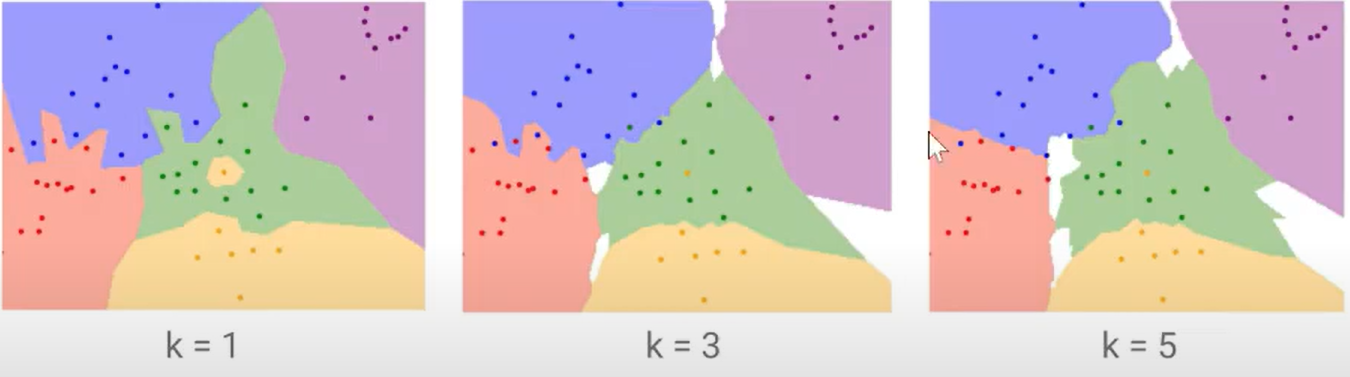
4. K 값 선택 방법
K 값이 너무 작거나 크면 성능이 저하될 수 있음.
- K가 작을 때 (K=1, 3)
- 데이터에 민감하여 과적합(Overfitting) 발생 가능
- 노이즈에 취약
- K가 클 때 (K=10, 20)
- 경계를 부드럽게 만들어 일반화(Generalization) 가능
- 하지만 너무 크면 성능 저하
📌 보통 홀수(K=3, 5, 7 등)를 사용하며, 데이터에 따라 최적의 K 값을 결정해야 함!
5. KNN의 장점과 단점
✅ 장점
- 이해하기 쉽고 직관적인 알고리즘
- 학습 과정이 필요 없어 빠르게 적용 가능
- 이상치(Outlier)에 비교적 강함
❌ 단점
- 데이터가 많아질수록 예측 속도가 느려짐 (메모리 사용량 증가)
- 차원이 증가하면 거리 계산이 어려워지는 차원의 저주(Curse of Dimensionality) 문제 발생
- K 값 및 거리 측정 방법 선택이 중요
6. KNN을 잘 활용하려면?
📌 K 값 최적화: Grid Search 또는 Cross Validation을 활용
📌 거리 측정 방식 선택: 유클리드 거리 외에 맨해튼 거리 등 다양한 거리 척도 고려
📌 고차원 데이터 처리: PCA(차원 축소) 또는 특징 선택 기법 적용
KNN은 단순하지만 직관적이고 강력한 모델입니다.
데이터가 적거나 패턴이 명확할 때 유용하지만, 대용량 데이터에서는 속도 문제를 고려
Iris예시 with Python
model and data import
import numpy as np
import pandas as pd
import matplotlib.pyplot as plt
from sklearn.datasets import load_iris

iris = load_iris()
iris
out:
{'data': array([[5.1, 3.5, 1.4, 0.2],
        [4.9, 3. , 1.4, 0.2],
        [4.7, 3.2, 1.3, 0.2],
        [4.6, 3.1, 1.5, 0.2],
        [5. , 3.6, 1.4, 0.2],
        [5.4, 3.9, 1.7, 0.4],
        [4.6, 3.4, 1.4, 0.3],
        [5. , 3.4, 1.5, 0.2],
[4.4, 2.9, 1.4, 0.2], ...iris.feature_namesout:
['sepal length (cm)',
 'sepal width (cm)',
 'petal length (cm)',
 'petal width (cm)']
preprocessing and fit
from sklearn.model_selection import train_test_split
X_train,X_test,y_train,y_test = train_test_split(iris.data,iris.target,test_size = 0.2,random_state = 42)
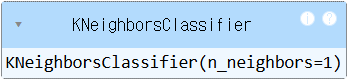
from sklearn.neighbors import KNeighborsClassifier
knn = KNeighborsClassifier(n_neighbors = 1)
knn.fit(X_train,y_train)out:
The process of optimizing hyperparameters
for i in (1,3,5,7): #k의 갯수
    for j in ('uniform', 'distance'): #거리계산
        for k in ('auto','ball_tree','kd_tree','brute'): #최적화 algorithm
            model = KNeighborsClassifier(n_neighbors=1, weights=j,algorithm=k)
            model.fit(X_train,y_train)
            y_p = model.predict(X_test)
            relateion_square = model.score(X_test,y_test)
            from sklearn.metrics import confusion_matrix, classification_report
            knn_matrix = confusion_matrix(y_test,y_p)
            print(knn_matrix)
            target_names = ['setosa', 'cersicolor', 'virginica']
            knn_result = classification_report(y_test,y_p,target_names=target_names)
            print(knn_result)
        print('\n')
    print('\n')
out:
[[10  0  0]
 [ 0  9  0]
 [ 0  0 11]]
              precision    recall  f1-score   support

      setosa       1.00      1.00      1.00        10
  cersicolor       1.00      1.00      1.00         9
   virginica       1.00      1.00      1.00        11

    accuracy                           1.00        30
   macro avg       1.00      1.00      1.00        30
weighted avg       1.00      1.00      1.00        30

[[10  0  0]
 [ 0  9  0]
 [ 0  0 11]]

...- is not good
- Iris data is tripple classification so we set the target_names -> 3 things
- weighted avg: Arithmetic mean of F1 SCROE by label
- the data split is random so we don't know that's the best optimized

gpt로 다시 배우는 개발